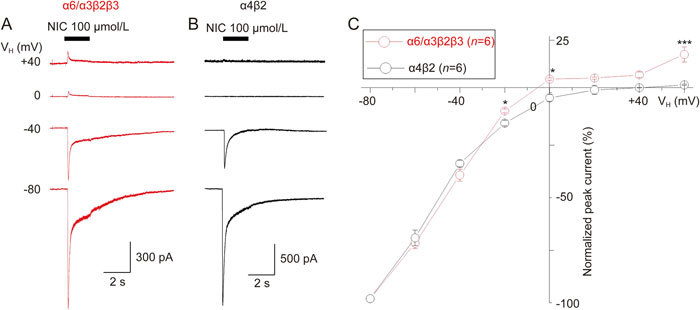
Figure 7.

Current-voltage (I-V) relationship curve for α6*-nAChR-mediated whole-cell current in SH-EP1 cells. (A) Typical traces of current-voltage (I-V) relationship using K+ electrodes at a different (from -80 to +60 mV) holding potentials (VH), 100 μmol/L NIC was repetitively applied for 2 s at 2-min intervals to SH-EP1 cells expressing α6*-nAChR (A). (B) Under the same experimental protocol, 100 μmol/L NIC was repetitively applied for 5 s at 2-min intervals to SH-EP1 cells expressing α4β2-nAChR (B). Peak nicotine currents from whole-cell current traces were normalized to the peak current amplitude at the VH of -80 mV (indicated as #) and plotted against the peak currents at different holding potentials. Each symbol represents the average from 6 cells tested, and vertical bars represent standard errors. Asterisks * and *** represent significance levels of P<0.05 and P<0.001, respectively, for α6*-nAChR (red symbols) vs α4β2-nAChR (black symbols).
