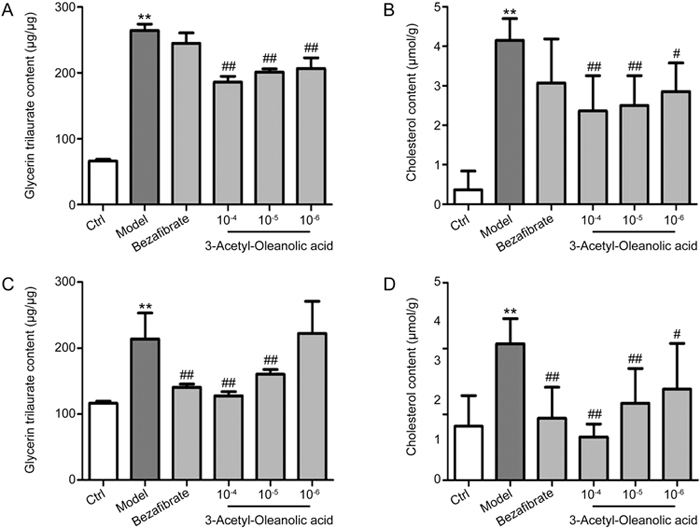
Figure 2.

Measurement of the intracellular TG and TC levels in FFA-induced HepG2 cells and primary rat hepatocytes (Model: 0.5 mmol/L FFA; bezafibrate: 100 μmol/L; 10-4: 3Ac-OA 100 μmol/L; 10-5: 3Ac-OA 10 μmol/L; 10-6: 3Ac-OA 1 μmol/L); (A) Measurement of the intracellular TG levels in FFA-induced lipid storage in HepG2 cells. (B) Measurement of the intracellular TC levels in FFA-induced lipid storage within HepG2 cells. (C) Measurement of the intracellular TG levels in FFA-induced lipid storage in primary rat hepatocytes. (D) Measurement of the intracellular TC levels in FFA-induced lipid storage in primary rat hepatocytes. ** P<0.01, compared with control group. # P<0.05, ## P<0.01, compared with model group.
