Figure 7.

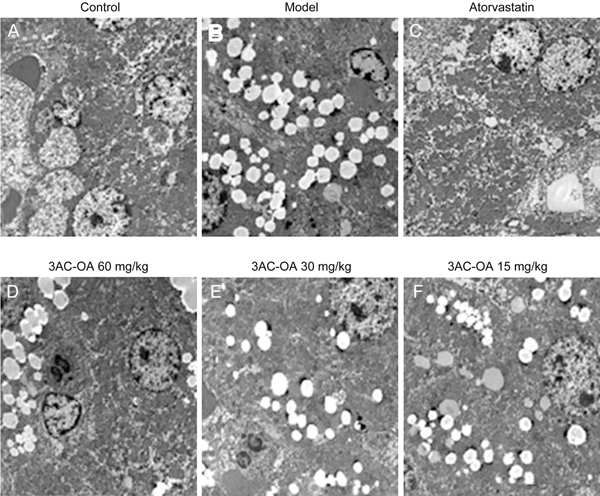
Representative electron micrograph of ultra-thin sections of liver tissue from the control group, model group (HFD), atorvastatin group and 3Ac-OA groups (60, 30, 15 mg/kg).

Representative electron micrograph of ultra-thin sections of liver tissue from the control group, model group (HFD), atorvastatin group and 3Ac-OA groups (60, 30, 15 mg/kg).