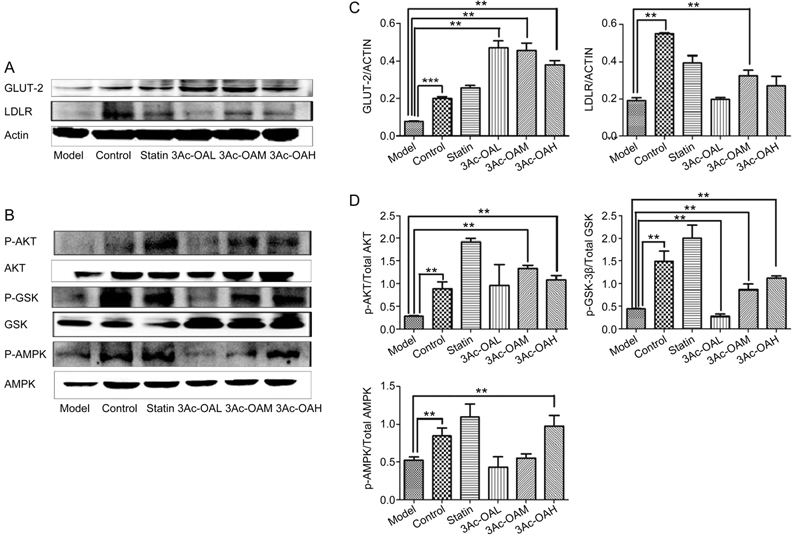
Figure 9.

(A–B) Representative western blots of total protein extracts from the control group, HFD group, Atorvastatin group, 3Ac-OAH group (60 mg/kg), 3Ac-OAM group (30 mg/kg), and 3Ac-OAL group (15 mg/kg); n=6 in each experimental group. (C–D) The fold-change was calculated based on the densitometric analysis of band intensities. ** P<0.01 vs model group.
