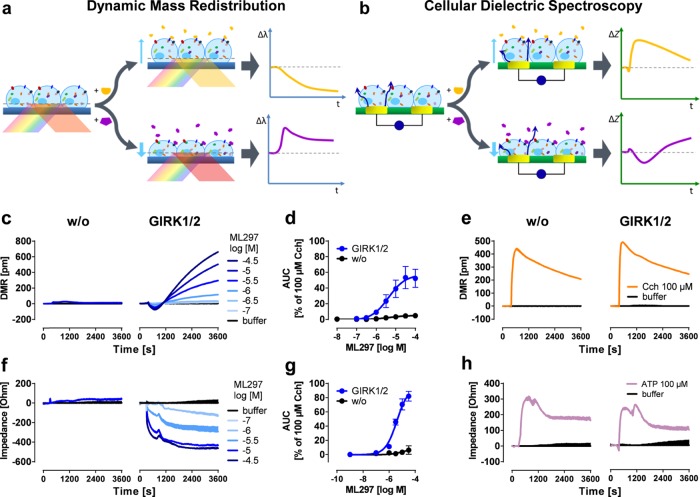
Figure 1.
Label-free readouts visualize ML297-induced responses in a GIRK1/2-specific manner. (a) DMR assay: cells are located on top of a resonant waveguide grating biosensor and exposed to polychromatic light at wavelengths between 827 and 832.5 nm. The composition of the optical grating and properties of the cells result in penetration of light ∼150 nm into the cells37−39 (area of detectable DMR). In this area, a specific wavelength of light is reflected, whereas the rest is absorbed. If addition of pharmacological stimuli leads to changes in cellular morphology, the optical density within the “detection zone” is altered leading to a change in the reflected wavelength [λ]. Compounds that cause a decrease in mass proximal to the biosensor (yellow trace) shift the reflected light to shorter wavelengths, whereas an increase of mass (purple) results in a shift to longer wavelengths.13 (b) CDS assay: a monolayer of cells is cultivated on top of an electrical biosensor. Alternating voltages at set frequencies are applied through electrodes, which generate transcellular and extracellular currents (dark blue arrows). Addition of biologically active compounds influences the morphological structure of the monolayer. This change might include spreading and migration of the cells to cover more of the electrode’s surface area, or modifications in intercellular connections, which in turn leads to an alteration of the well’s impedance [Z].25−27,40,41 In the following, only the change in extracellular impedance, measured at frequencies between 3320 and 24 700 Hz (factory default setting), is shown. (c,f) Exemplary DMR and impedance traces of ML297-stimulated HEK cells either lacking or recombinantly expressing GIRK1/2. (d,g) Concentration-effect-curves calculated from the area under the curve (AUC) of DMR and impedance between 0 and 3600 s and normalized to the AUC of 100 μM Cch (n = 3). For pEC50 values, see Table S1. (e,h) Control signals of ATP and Cch in the absence or presence of GIRK1/2.

