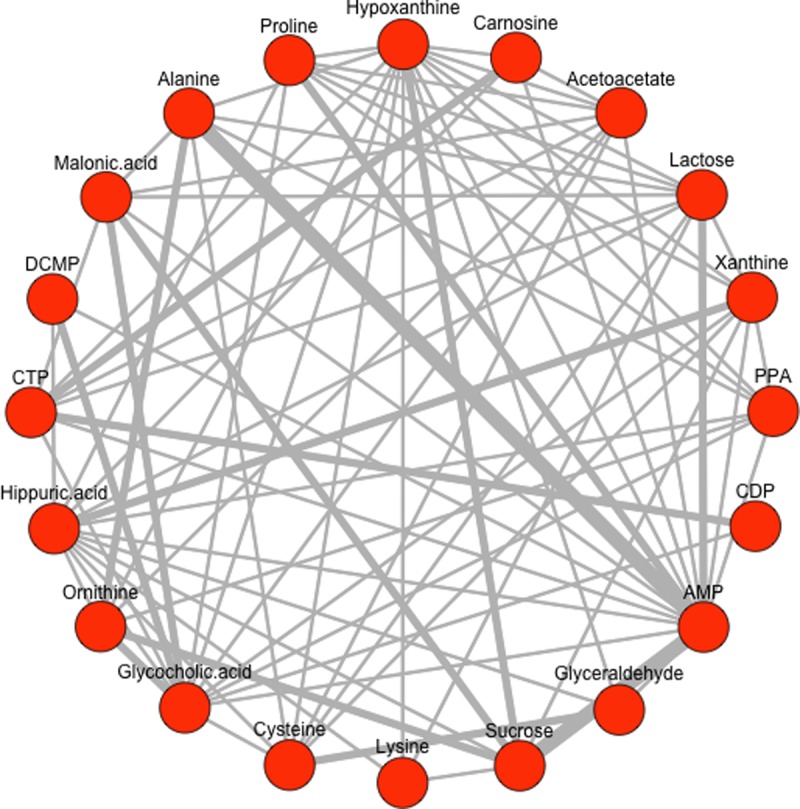
Fig 4. Combined network graph with discrete weighted edges.

The graph combines the networks of the four measurement points inferred with the static threshold τs = τ3 (q90) where thicker line widths indicate stronger interactions and serves as an indicator for the frequency of its occurrence in all of the networks combined.
