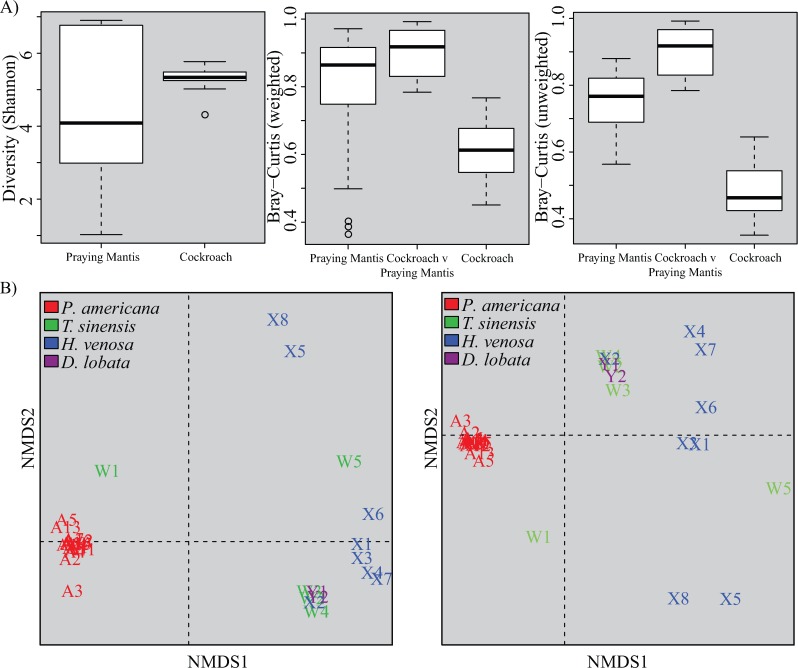
Fig 1. Alpha and beta diversities among praying mantids and cockroaches.
A) Boxplots show Shannon diversity indices (left), and weighted (middle) and unweighted (right) Bray-Curtis dissimilarities among praying mantid and cockroach gut microbial communities at 97% sequence identity. The boxplots with Bray-Curtis metrics also display the dissimilarity between praying mantid and cockroach gut microbial communities. Libraries were resampled to a depth of the sample with the fewest sequences (3901). For each group, the bars delineate the median, the hinges represent the lower and upper quartiles, the whiskers extend to the lesser of the most extreme value or 1.5 times the interquartile range, and outliers are plotted, if present. B) Nonmetric multidimensional scaling (NMDS) plots of insects constructed with weighted (left) and unweighted (right) metrics. Libraries were resampled to a depth of the sample with the fewest sequences (3901). Constructed plots had stress values of 0.044 (weighted) and 0.046 (unweighted). Points are color coded by insect species and were left in text format, such that the text at each point corresponds to the metadata provided in Tables 1 and S1.

