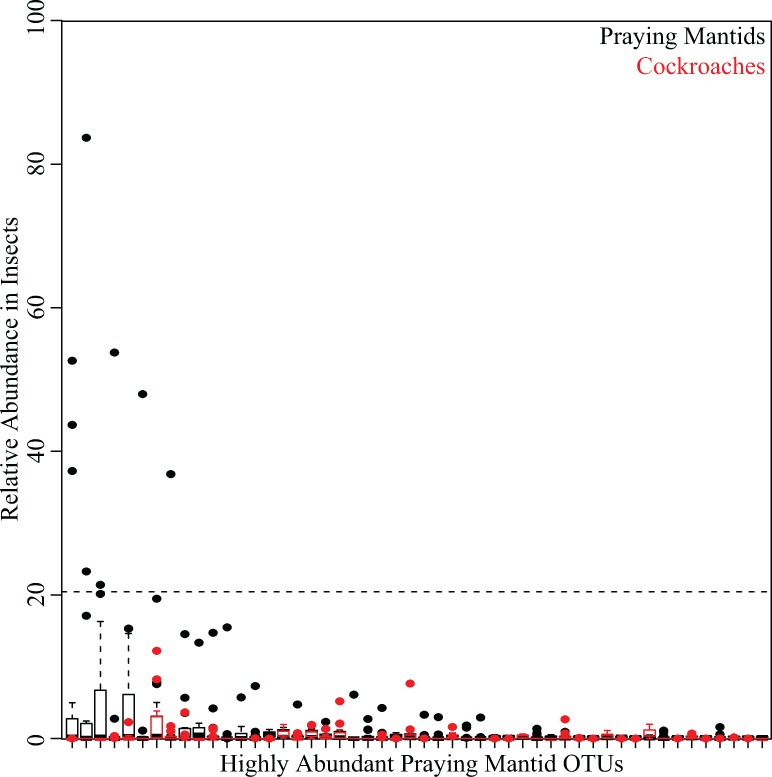
Fig 4. Relative abundance of the 50 most abundant praying mantis OTUs in insects.
Two boxplots are shown at each OTU; they depict the relative abundance of that OTU among all praying mantids (black) and all cockroaches (red). For each boxplot, the bars delineate the median, the hinges represent the lower and upper quartiles, the whiskers extend to the lesser of the most extreme value or 1.5 times the interquartile range, and outliers are plotted, if present. There are 10 OTUs that were above 20% relative abundance within a single gut sample. These 10 OTUs were present in 9 unique mantid individuals (one mantid had two OTUs present at > 20%).

