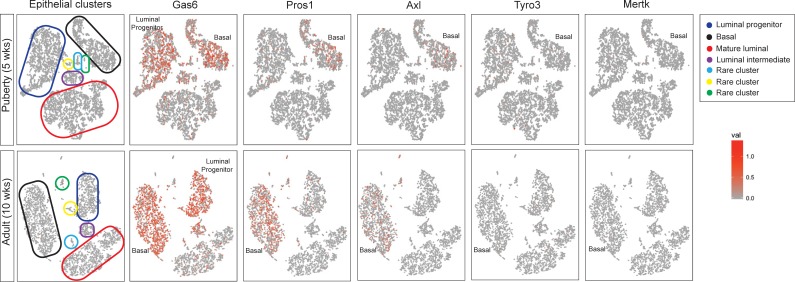
Fig 1. TAMR expression and their ligands in mammary epithelial cells during mammary gland development.
2-D t-SNE projection plots of scRNA-seq data from mammary epithelial cells isolated from pubertal and adult mouse mammary gland. Tyro3, Axl, Mertk, Gas6 and Pros1 expression in different epithelial cell clusters [20]. Each cell was colored by normalized expression of the genes in the cell. Color scale represents the normalized UMI (unique molecular identifier) counts for each gene under a log10 scale.

