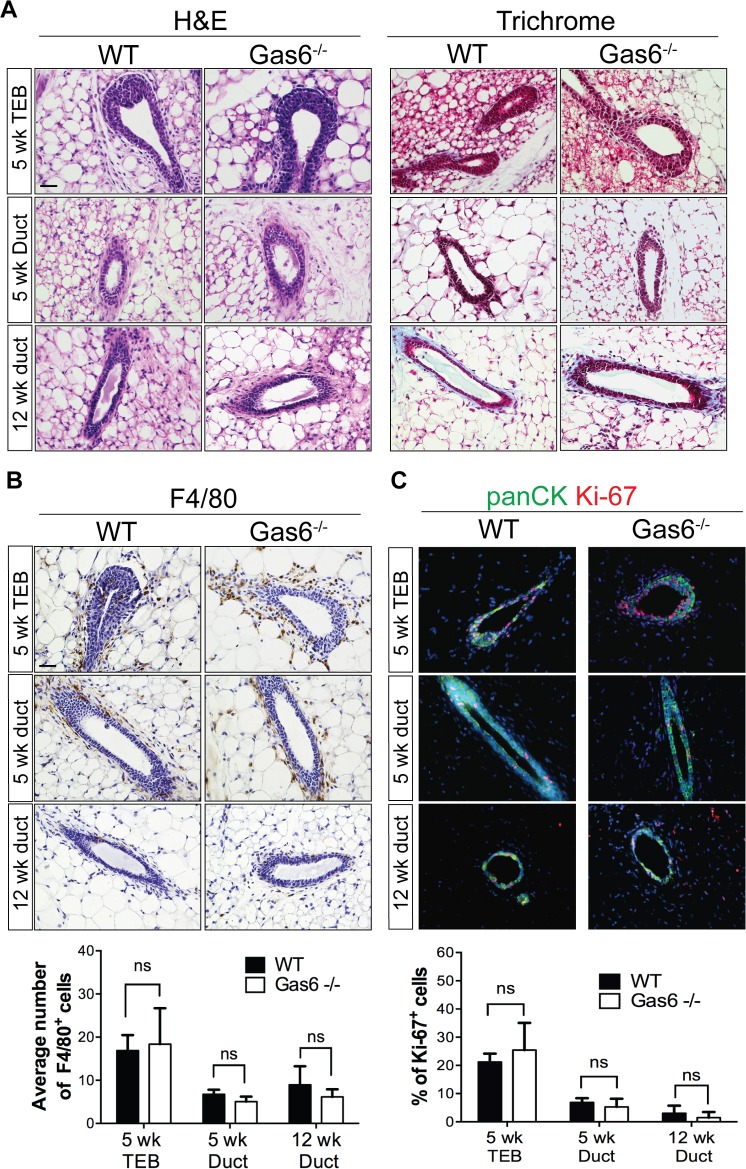
Fig 4. Histological characterization of Gas6-/- mammary ducts.
(A) Representative images of mouse mammary tissue stained with H&E and Masson’s trichrome (3 glands from 3 mice). Scale bar = 20 μm. (B) Representative images of mouse mammary tissue from wildtype and Gas6-/- animals stained with an antibody for F4/80. Graph depicts quantification of the average number of F4/80+ cells in wild type and Gas6-/- mammary sections. For each gland, a minimum of 4 ducts and 4 TEBs were counted from 3 glands (3 mice) for each group (5 wk TEB p = 0.81; 5 wk duct p = 0.25; 12 wk duct p = 0.56). Scale bar = 20 μm. (C) Representative immunofluorescence images of mammary sections stained with antibodies for Ki-67 (red) and panCK (green) are depicted. Graph shows quantification of the average number of Ki-67+ cells in WT (5 week, n = 7; 12 week, n = 5) and Gas6-/- (5 week, n = 5; 12 week, n = 4) mammary glands, where n is the number of animals. For each gland, a minimum of 4 ducts and 4 TEBs were counted per animal (5 week TEB p = 0.41; 5 week duct p = 0.46; 12 week duct p = 0.64). Scale bar = 20 μm.

