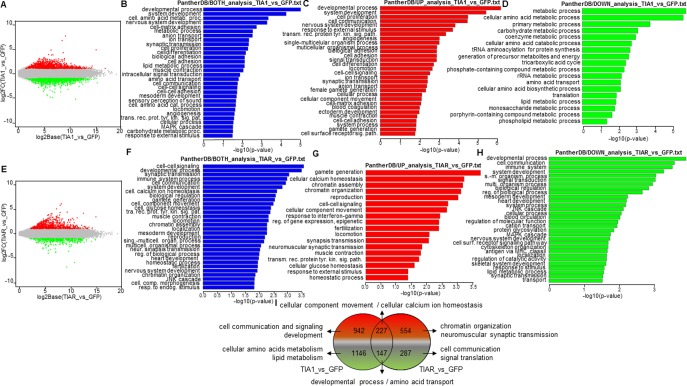
Fig 2. Gene Ontology (GO) analysis of differentially expressed genes (DEGs) in GFP-, GFP-TIA1b-, and GFP-TIARb-expressing FT293 cells.
(A-H) Top categories of biological processes associated with DEGs. (A and E) MA plot representations of the distributions of up- (spots in red) and down- (spots in green) expressed genes (-1 ≥ log fold change ≤ 1; FDR < 0.05) in the corresponding combinations indicated in A and E panels, respectively. (B-D and F-H) Histograms of the distributions of up- and down-regulated genes (B and F), only up-regulated genes (red in C and G) and only down-regulated genes (green in D and H) in the corresponding combinations using the GO PANTHER database (P < 0.05). (I) Venn diagram displaying numbers and GO enriched categories of DEGs in TIA1- and TIAR-expressing FT293 cells compared with control (GFP-expressing FT293 cells).

