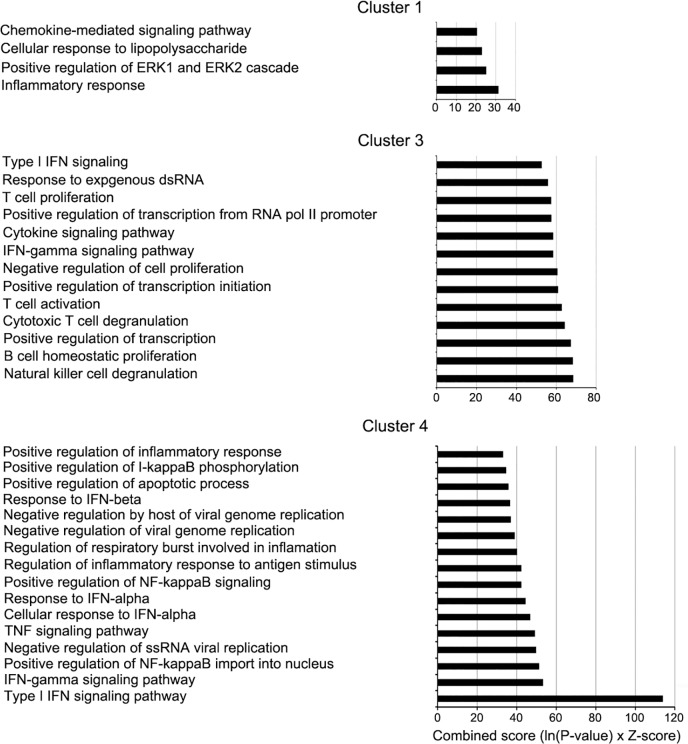
Fig 4. Clustering and pathway analysis of genes suppressed by active NS1.
Bar graphs demonstrate the enriched biological processes associated with cluster 1, 3, and 4 in Fig 3, which were plotted against the combined score (Enrichr) on the y-axis. Cluster 2 showed no significant enriched biological process.

