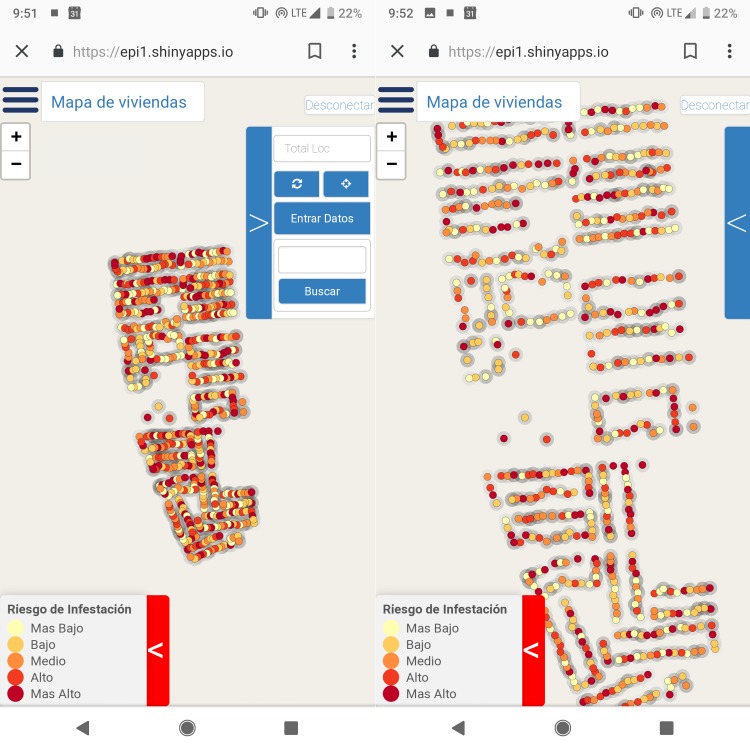
Fig 1. T. infestans infestation risk map zoomed out (left) and zoomed in (right).
Houses are represented by dots that are colored according to their risk of infestation as estimated by the model. Legend translates to (from top to bottom): ‘Risk of infestation- Lowest; Low; Medium; High; Highest.’ Note that the images display infestation data overlay and app functions only; cartographic details (i.e., roads, parks, etc) have been removed for this publication. Images of the app with cartographic detail derived from data available at the OpenStreetMap project (openstreetmap.org) for the municipality of Arequipa, Perú, and served by MapBox (mapbox.com) are available in the VectorPoint repository, https://github.com/chirimacha/VectorPoint.

