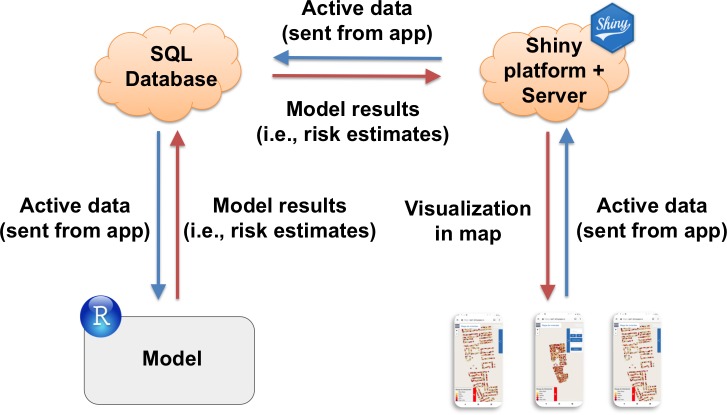
Fig 4. VectorPoint workflow diagram.
From left, risk estimates generated by the model are first sent to an SQL database, and then sent to the Shiny platform and server for visualization in the risk map. From right, data collected by the app are sent to the Shiny server and then to the SQL database. The model then pulls the new data from the SQL database the next time it is run. All data are TLS encrypted.

