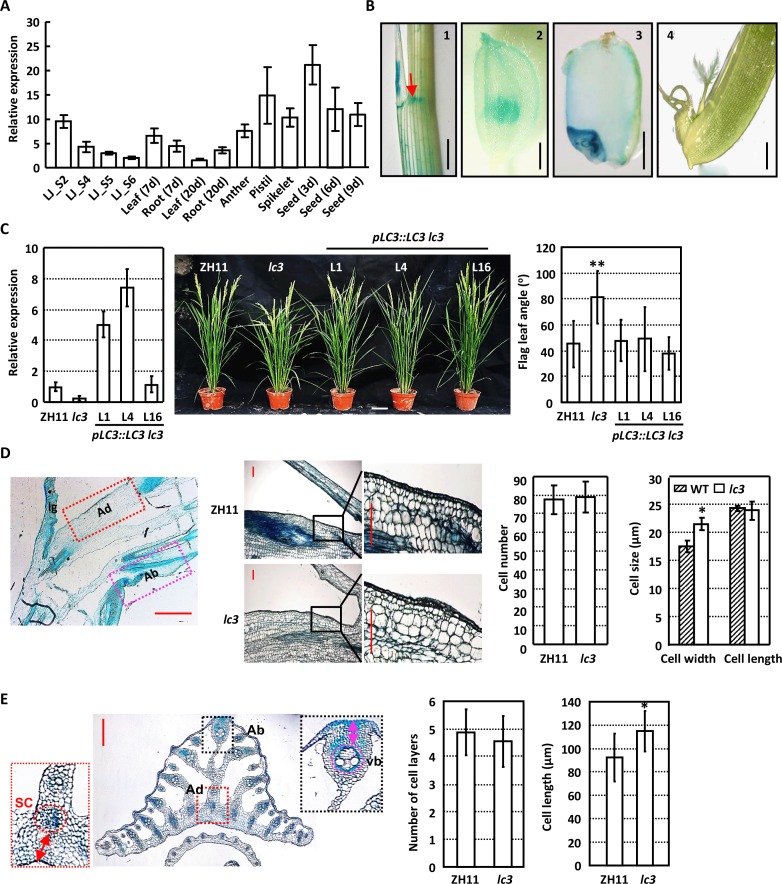
Fig 1. LC3 regulates rice leaf inclination.
(A) qRT-PCR analysis reveals the LC3 transcripts in various tissues, including lamina joint at different developmental stages (LJ_S2, S4, S5, S6 are four developmental stages of lamina joint according to Zhou et al., 2017), leaf, root and stem of 7- or 20-day-old plants, seed (3, 6, 9 d after fertilization), anther, pistil and spikelet. Transcription levels of LC3 were normalized with that of Actin and LC3 expression level in leaf at 20 days was set as 1.0. Analyses were repeated three times and data are shown as means ± SE (standard error). (B) Promoter-reporter gene (GUS) fusion studies reveal the LC3 expression at lamina joint (1), glume and pollen (2), seed (3) and pistil (4). Representative images are shown. The red arrow indicates the adaxial side of collar. Bars = 2 mm (1–3) or 500 μm (4). (C)Phenotypic observations (middle, bar = 10 cm) and measurement (right) show that complemented LC3 expression in lc3 mutant (left) results in the recovered leaf inclination. Angles of rice flag leaf at 10 days after heading were measured and data are presented as means ± SD (standard deviation, n>30). Statistical analysis by using Student’s t-test reveals the significant differences compared to that of ZH11 (**, p<0.01). (D) Longitudinal section of the lamina joint of ZH11 flag leaves at 10 days after heading. ad, the adaxial region close to ligule; ab, the abaxial region away from ligule; lg, ligule (left, Bar = 400 μm). Morphology of longitudinal sections through the lamina joint of flag leaves of ZH11 and lc3 plants at 10 days after heading are shown (middle, bar = 50 μm). The squared regions were magnified to highlight the differences. Cell number and size (cell width and length) of the second layer parenchyma cells at the adaxial side were calculated and statistically analyzed by Student’s t-test (right). Experiments were repeated three times and data are presented as means ± SD (n > 30; *, p<0.05). (E) Anatomy of the lamina joint of ZH11 flag leaves at 10 days after heading. ad, the region between the adaxial epidermis and sclerenchyma (sc) of the cross section; ab, the region between the abaxial epidermis and the abaxial central vascular bundle (vb) of the cross section (left, bar = 400 μm). The number of sclerenchyma cell layers (middle) and the length of ad (right) of ZH11 and lc3 mutants were calculated and statistically analyzed by using Student’s t-test. Data are shown as means ± SD (n>30; *, p<0.05).

