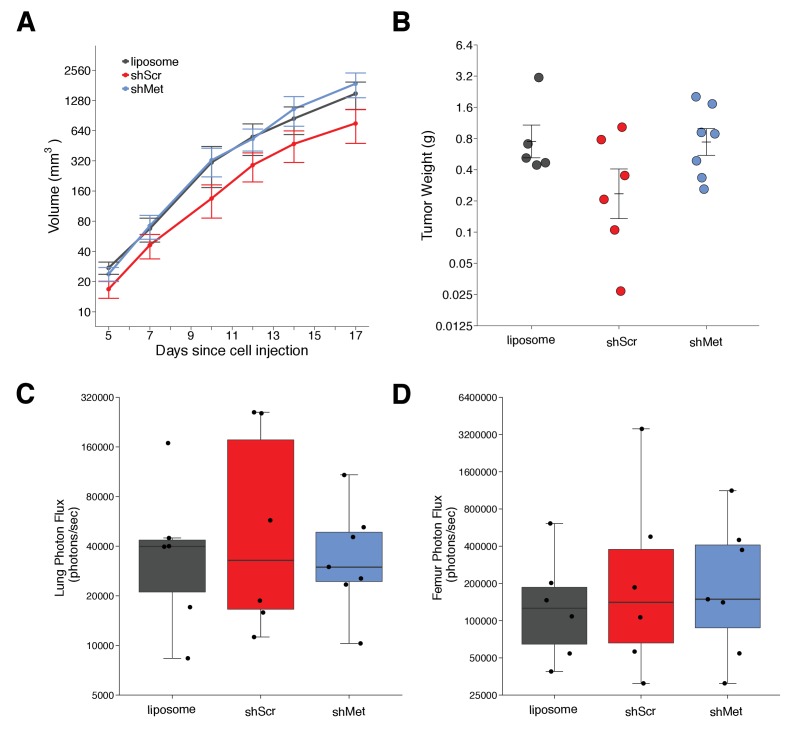
Figure 2. Primary tumor growth and metastatic burden of mice injected with exosomes.
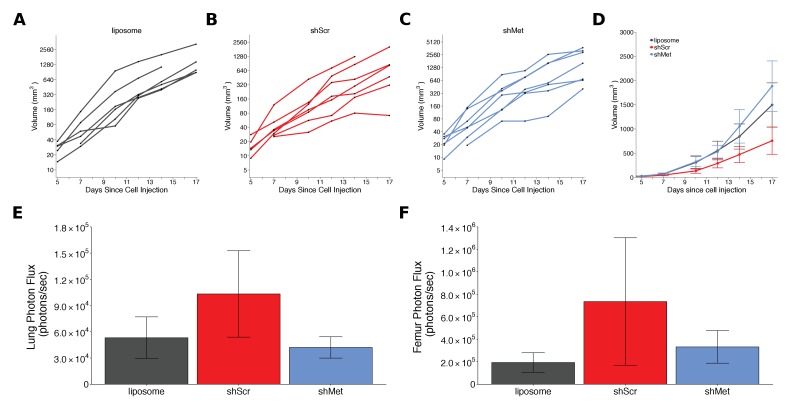
Female C57BL/6 mice were subcutaneously injected with B16-F10-luciferase cells after 4 weeks of intravenous injections (3 times a week) of shScr exosomes, shMet exosomes, or synthetic liposomes. (A) Following primary tumor detection caliper measurements were taken 3 times a week and used to calculate tumor volume. Line graph of tumor volume (y-axis is natural log scale) with means reported and error bars representing s.e.m. Number of mice monitored per group: synthetic liposomes = 7, shScr = 7, shMet = 7. Of note, not all mice had detectable primary tumors at the first measurement, one of the mice injected with synthetic liposomes never formed a detectable primary tumor despite the presence of metastatic burden, and two mice (one injected with B16-F19 shScr exosomes and one injected with synthetic liposomes) were found dead before the end of the study (day 17). Individual mouse tumor volume data is reported in Figure 2 - figure supplement 1. (B) At the end of the experiment (day 18), primary tumors were excised and weighed. Dot plot with means reported as crossbars and error bars represent s.e.m. Number of primary tumor weights per group: synthetic liposomes = 5, shScr = 6, shMet = 7. Kruskal-Wallis test on all three groups: H(2) = 2.85, p = 0.24. Planned Wilcoxon-Mann-Whitney comparison between shScr and synthetic liposomes: U = 22, p = 0.247, Cliff’s d = 0.47, 95% CI [-0.28, 0.86]. Planned Wilcoxon-Mann-Whitney comparison between shScr and shMet: U = 32, p = 0.138, Cliff’s d = 0.52, 95% CI [-0.10, 0.85]. (C) Metastatic burden in lungs quantified by luciferin photon flux at 18 days after B16-F10-luc tumor cell injections. Box and whisker plot (y-axis is natural log scale) with median represented as the line through the box and whiskers representing values within 1.5 IQR of the first and third quartile. Individual data points represented as dots. Number of mice per group: synthetic liposomes = 6, shScr = 6, shMet = 7. One-way ANOVA on the luciferin photon flux values (natural log-transformed); F(2,16) = 0.226, uncorrected p = 0.800 with a priori alpha level of 0.025, Bonferroni corrected p > 0.99. Planned contrast between shScr and synthetic liposomes; Fisher’s LSD test; t(16) = 0.543, p = 0.594 with a priori alpha level of 0.025, Bonferroni corrected p > 0.99, Cohen’s d = 0.31, 95% CI [-0.83, 1.45]. Planned contrast between shScr and shMet; Fisher’s LSD test; t(16) = 0.620, p = 0.544 with a priori alpha level of 0.025, Bonferroni corrected p > 0.99, Cohen’s d = 0.34, 95% CI [-0.76, 1.44]. (D) Metastatic burden in femurs quantified by luciferin photon flux at 18 days after B16-F10-luc tumor cell injections. Box and whisker plot (y-axis is natural log scale) with median represented as the line through the box and whiskers representing values within 1.5 IQR of the first and third quartile. Individual data points represented as dots. Number of mice per group: synthetic liposomes = 6, shScr = 6, shMet = 7. One-way ANOVA on the luciferin photon flux values (natural log-transformed); F(2,16) = 0.190, uncorrected p = 0.829 with a priori alpha level of 0.025, Bonferroni corrected p > 0.99. Planned contrast between shScr and synthetic liposomes; Fisher’s LSD test; t(16) = 0.573, p = 0.575 with a priori alpha level of 0.025, Bonferroni corrected p > 0.99, Cohen’s d = 0.33, 95% CI [-0.82, 1.46]. Planned contrast between shScr and shMet; Fisher’s LSD test; t(16) = 0.105, p = 0.918 with a priori alpha level of 0.025, Bonferroni corrected p > 0.99, Cohen’s d = 0.06, 95% CI [-1.03, 1.15]. Additional details for this experiment can be found at https://osf.io/mzywk/.


