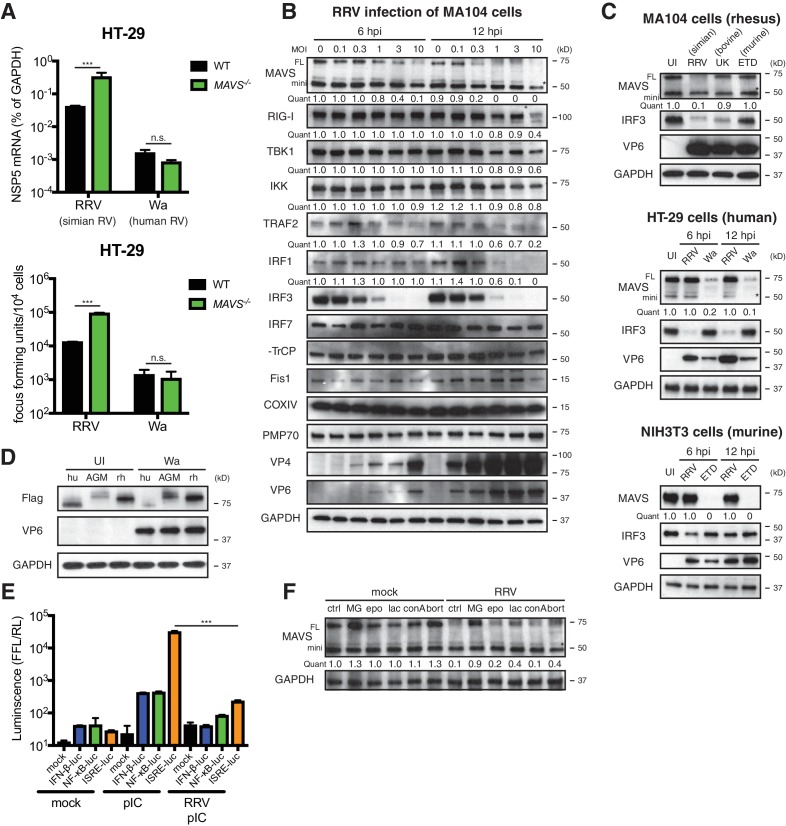
Figure 2. RV infection induces MAVS degradation in a host range restricted manner.
(A) WT and MAVS-/- HT-29 cells were infected with the simian RV RRV strain or the human RV Wa strain (MOI = 1) for 24 hr. Expression of viral gene NSP5 was measured by RT-qPCR and normalized to that of GAPDH. The virus yield in the supernatant was harvested and measured by a standard focus forming unit assay. (B) MA104 cells were infected with RRV at indicated MOIs for 6 or 12 hr. The lysates were harvested for western blot to examine the expression level of full-length (FL) and truncated mini-MAVS, other indicated RIG-I signaling factors, RV proteins (VP4, VP6) and GAPDH. The relative levels of individual proteins were quantified (quant) with respect to the GAPDH levels (lane 1 set as 1.0). (C) Rhesus MA104 cells, human HT-29 cells and murine NIH3T3 cells were infected with simian RRV, human Wa or murine ETD (MOI = 5) respectively and the protein levels of MAVS, VP6 and IRF3 were measured by western blot (UI: uninfected). (D) HEK293 cells were transfected with Flag-tagged MAVS from Homo sapiens (human, hu), Chlorocebus aethiops (African Green monkey, AGM), Macaca mulatta (rhesus monkey, rh) for 12 hr and infected with Wa (MOI = 3) for 12 hr. The protein levels of MAVS, VP6 and GAPDH were measured by western blot. (E) MA104 cells were transfected with luciferase expression constructs driven by IFN-β, NF-κB, or ISRE promoters, mock or infected with RRV (MOI = 3) for 8 hr, and stimulated with LMW poly (I:C) (pIC) for 8 hr. The level of firefly luciferase (FFL) was measured and normalized to that of renilla luciferase (RL), which serves as internal control. (F) MA104 cells were infected with RRV (MOI = 3) for 12 hr and treated with indicated proteasome and lysosome inhibitors for 12 hr. The lysates were harvested and MAVS level was measured by western blot. (MG: MG132; epo: epoxomicin; lac: lactacystin; conA: concanamycin A; bort: bortezomib). For all figures, experiments were repeated at least three times with similar results. Data are represented as mean ± SEM. Statistical significance is determined by Student’s t test (*p≤0.05; **p≤0.01; ***p≤0.001). (* represents mini-MAVS in all western blots).


