. 2018 Nov 21;7:e39494. doi: 10.7554/eLife.39494

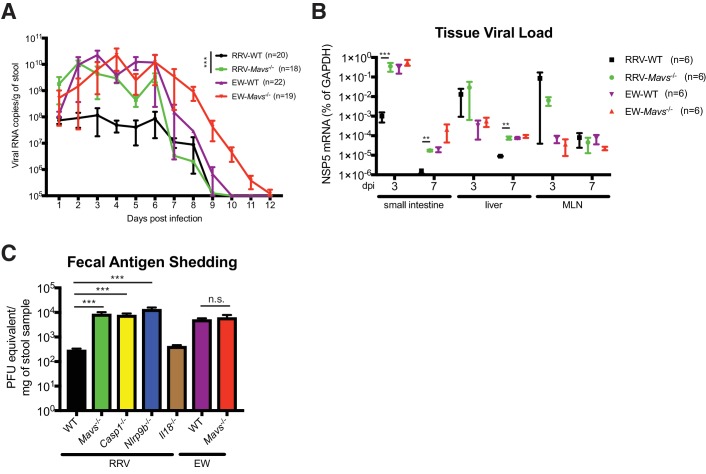
Figure 5. Replication of heterologous RV is enhanced in selected knockout mouse strains.

(A) Viral antigens in the fecal samples of EW or RRV-infected WT and Mavs-/- mice were measured by a standard ELISA assay over the course of 12 days. (B) Small intestines, liver and mesenteric lymph node (MLN) were harvested at 3 dpi or 7 dpi from EW or RRV infected animals and the levels of viral NSP5, indicative of virus replication, was measured by RT-qPCR and normalized to that of GAPDH. (C) C57Bl6/J mice with indicated gene deficiencies were infected with RRV (107 pfu) or EW (104 DD50). Three days later, feces samples were collected and tested by an ELISA assay for viral antigens and the amount of viruses were converted to PFU equivalents based on the standard curve. At least 8 mice were used in each group. For all figures, experiments were repeated at least two times. Data are represented as mean ± SEM. Statistical significance is determined by Student’s t test (*p≤0.05; **p≤0.01; ***p≤0.001).

Figure 5—source data 1. Source data for Figure 5A.
DOI: 10.7554/eLife.39494.013
Figure 5—source data 2. Source data for Figure 5B.
DOI: 10.7554/eLife.39494.014
Figure 5—source data 3. Source data for Figure 5C.
DOI: 10.7554/eLife.39494.015

Figure 5.

Figure 5—figure supplement 1. Heterologous RV induces robust type III IFN expression and is restricted by IFN and inflammasome signaling in vivo.

Figure 5—figure supplement 1.

(A) 5 day old WT B6129SF2/J pups were infected with an equivalent dose of murine EW or simian RRV for 48 hr and small intestinal IECs were harvested using an EDTA-DTT isolation method. The levels of murine MAVS, RV protein VP6 and GAPDH were determined by western blot. (UI: uninfected). (B) 5 day old B6129SF2/J mice were infected with an equivalent dose of murine EW or simian RRV for 48 hr and IECs in the small intestine were harvested using an EDTA-DTT isolation method. The RNA levels of Mavs were measured by RT-qPCR analysis. (C) Same as (a) except that NSP5 and Ifnl3 were measured instead of Mavs. For all figures, experiments were repeated at least two times with at least four pups in each group. Data are represented as mean ± SEM. Statistical significance is determined by Student’s t test (*p≤0.05; **p≤0.01; ***p≤0.001).