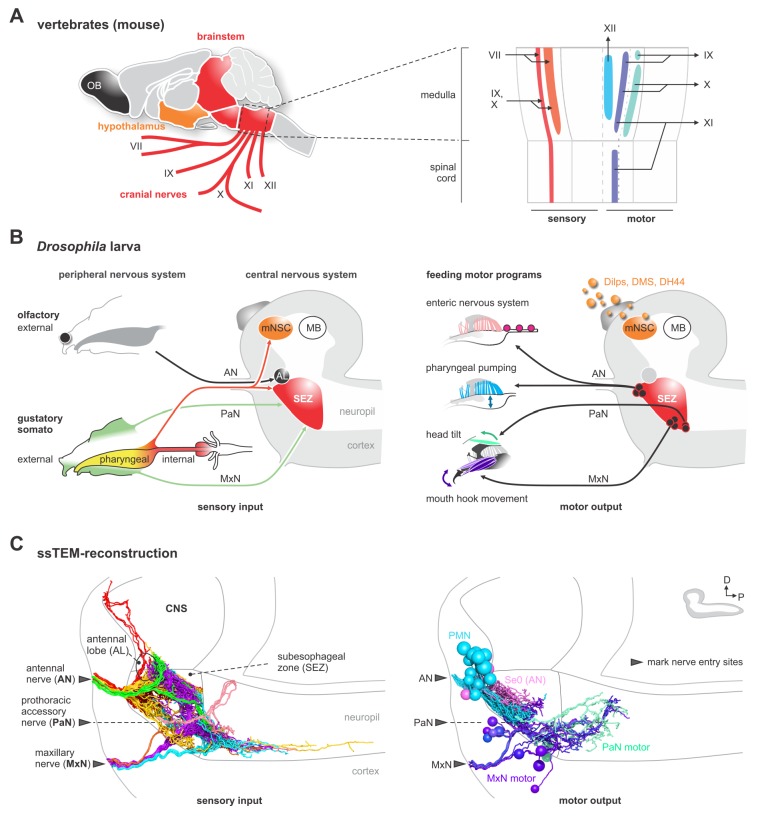
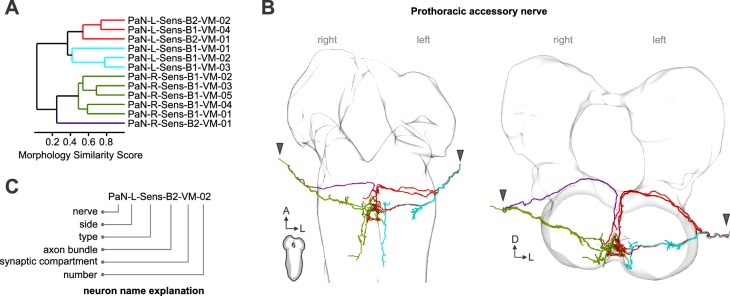
Figure 1. EM reconstruction of the pharyngeal nerves of Drosophila larva.
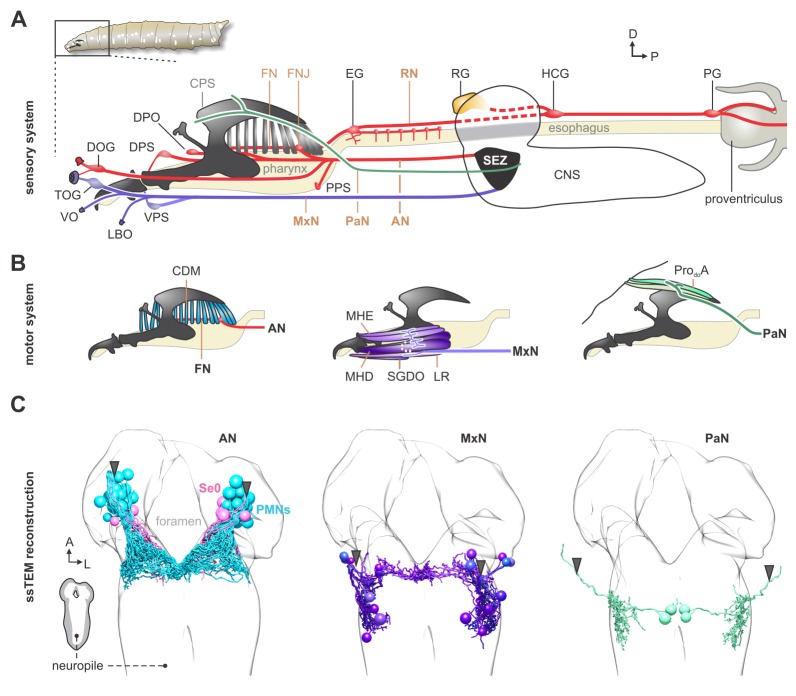
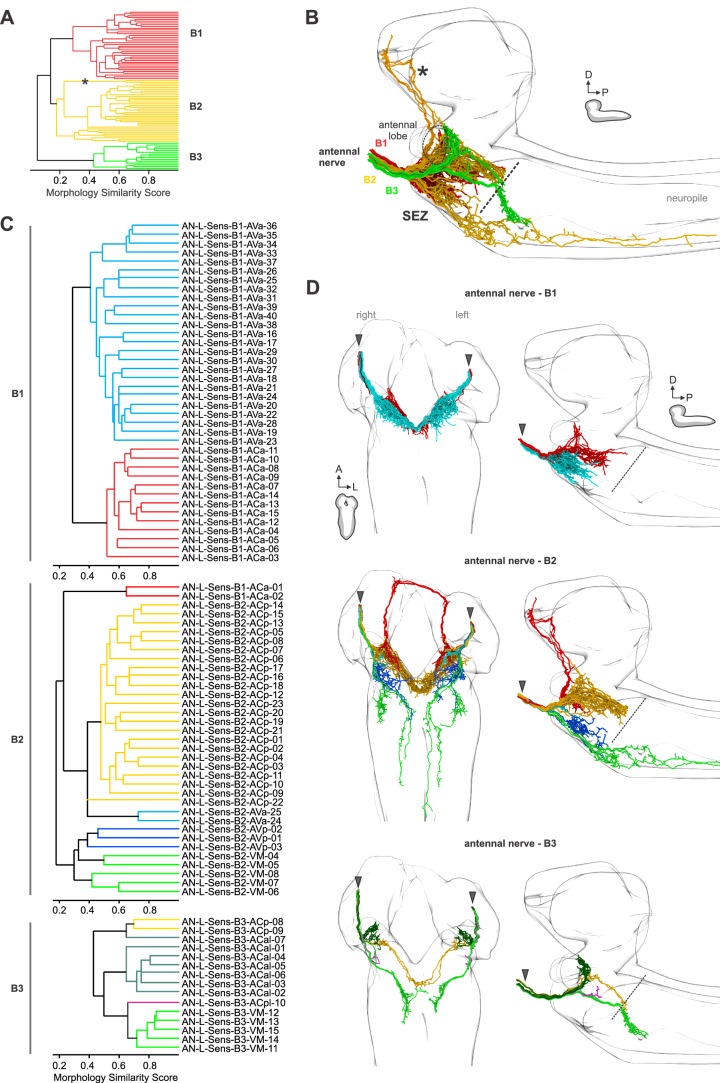
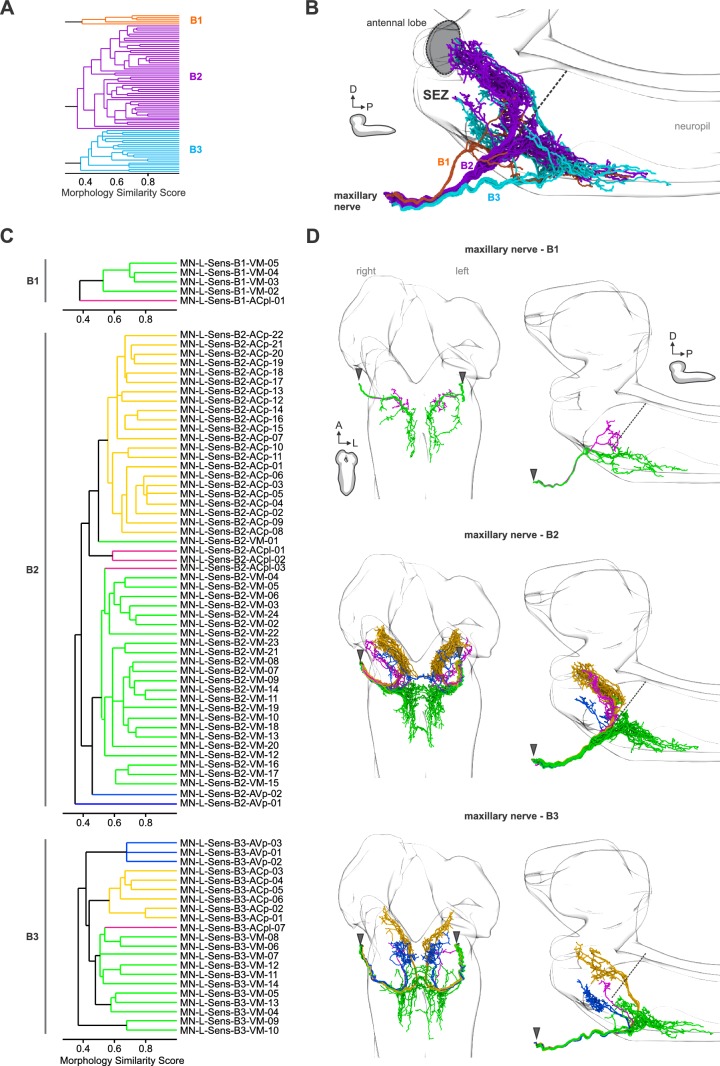
(A) Left: schematic diagram shows a lateral view of an adult mouse brain and the broad organization of different cranial nerves targeting the medulla of the brainstem. Right: topographical chart of the medulla and part of the spinal cord. Primary sensory and primary motor nuclei are shown on the left and on the right, respectively. (B) Schematic overview of external, pharyngeal and internal sensory systems targeting the subesophageal zone (SEZ), median neurosecretory cells (mNSCs) and the antennal lobe (AL) in Drosophila (left panel). Schematic overview of central output neurons targeting feeding related muscles and the enteric nervous system (right panel). Median neurosecretory cells (mNSCs) target neuroendocrine organ and the periphery, by releasing neuropeptides such as Dilps, DMS and DH44. The mushroom body (MB), a learning and memory center, serves as a landmark. (C) EM reconstruction of pharyngeal sensory input (left panel). Sensory neurons enter the brain via the antennal nerve (AN), maxillary nerve (MxN) and prothoracic accessory nerve (PaN), and cover large parts of the SEZ (left panel). Arrowheads mark respective nerve entry site. Two of the AN sensory projections (per side) extend into the protocerebrum. EM reconstruction of pharyngeal motor output (right panel). Pharyngeal motor neurons (PMNs) and serotonergic output neurons (Se0) leave the CNS via the antennal nerve (AN) and innervate the cibarial dilator musculature (for pharyngeal pumping) and part of the esophagus and the enteric nervous system. MxN motor neurons leave the CNS via the maxillary nerve (MxN) and innervate mouth hook elevator and depressor, labial retractor and salivary gland ductus opener. PaN motor neurons leave the CNS via the prothoracic accessory nerve (PaN) and innervate the dorsal protractor (for head tilt movements). All neurons are colored based on their morphological class. See Figure 1—figure supplements 1–4 and Figure 2—figure supplement 6 for detailed anatomy and description of morphological clustering.

