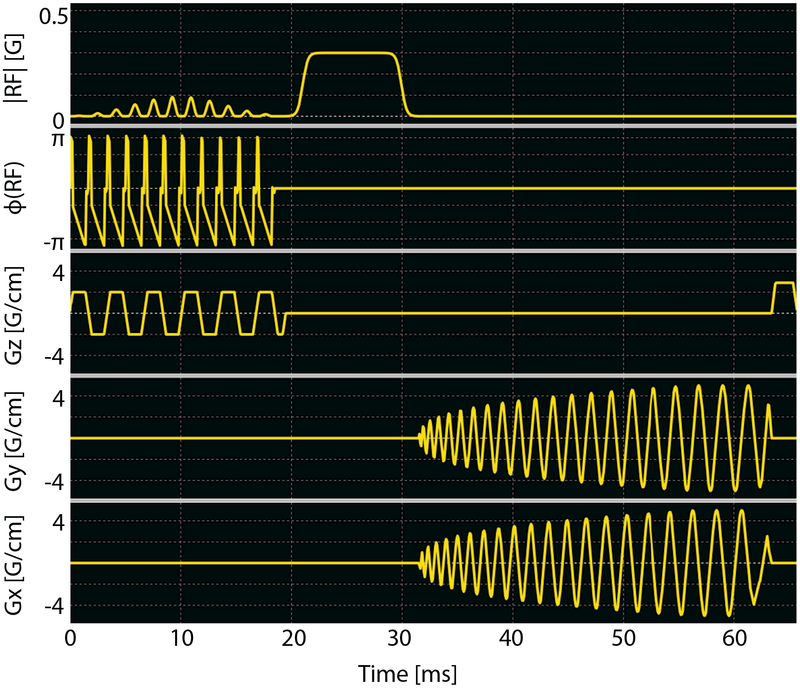
Figure 2:
Metabolite-specific imaging sequence used in this study, where all instances included a singleband spectral-spatial excitation pulse (passband 120 Hz, stopband 600 Hz) and a single-shot spiral readout. The sequence shown also includes an off-resonance Fermi pulse (TRF = 12 ms, ωRF = ±4.5 kHz) for Bloch-Siegert B1 mapping, while bolus tracking and pyruvate/lactate dynamic imaging also used this sequence but without Fermi pulse and its associated delay. Other key parameters for bolus tracking were FA 5° (pyruvate), TR 1s; and for Bloch-Siegert B1 mapping were FA 10° (pyruvate), TR 200ms.

