Figure 3.

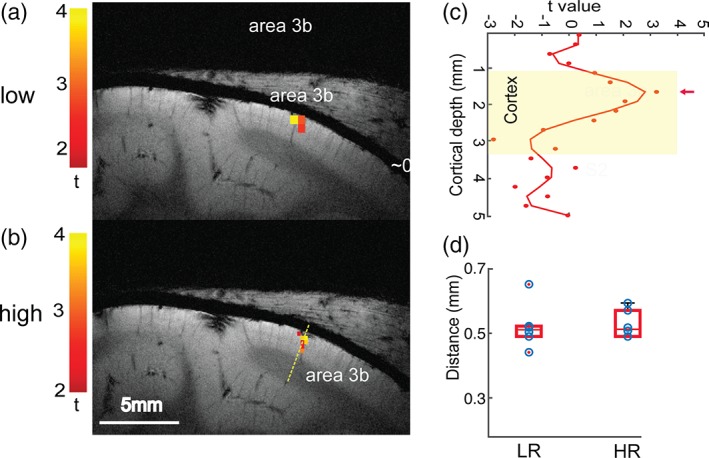
Comparison of BOLD tactile activation maps across cortical layers at two spatial resolutions. (a, b) Low‐ (a) and high‐resolution (b) BOLD activation maps in areas 3b and 1 to D2 tactile stimulation in one representative subject. All activation maps were thresholded at p < .05 (FWE corrected). Color scales represent t values. (c) 1‐D plot of the distribution of t values (color dots) measured (mm) along the yellow dotted line in B, starting from the CSF extending over the white matter through the cortex. High‐order polynomial (n = 8) fitting was used to illustrate the BOLD peak activation foci. The yellow background shows the width of the cortex. (d) Boxplot shows the distribution of the cortical depth of activation of BOLD signals from the cortical surface for low‐ (LR) and high‐resolution (HR) data. Individual data points are presented using blue circles [Color figure can be viewed at http://wileyonlinelibrary.com]
