
Figure 6.
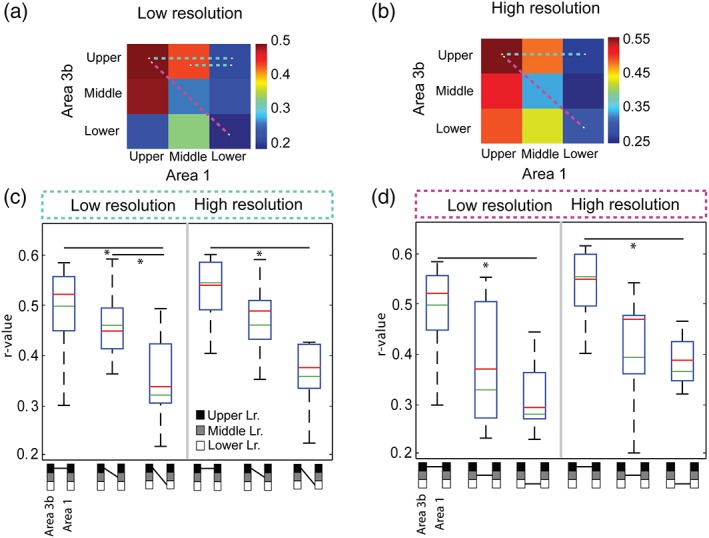
Group quantification of interlaminar rsFC of BOLD signals between areas 3b and 1 at low and high resolutions. (a, b) 2D matrix plots of pairwise interlayer mean correlations (r values) of BOLD signals between upper, middle, and lower layers of areas 3b and 1 at low (a) and high (b) resolutions. Dotted color lines link the layer pairs showing statistically significant correlation differences. (c, d) Boxplots of the distributions of rsFC (r values) between specific layer pairs of areas 3b and 1 for low‐ (c) and high‐resolution (d) rsfMRI data. Green line: mean. Red line: median values across the runs and animals (n = 4). Symbols below the x axis represent the specific pair of layers examined (linked by short black lines; black: upper, gray: middle, white: lower). These values were included in the statistical test. *p < .05, (MWW, Mann Whitney Wilcoxon test, FWE multiple comparison corrected). Symbols below the box plots represent the different pair of layers. Layers are linked by short black lines; black square: upper layer, gray square: middle layer, white square: lower layer [Color figure can be viewed at http://wileyonlinelibrary.com]