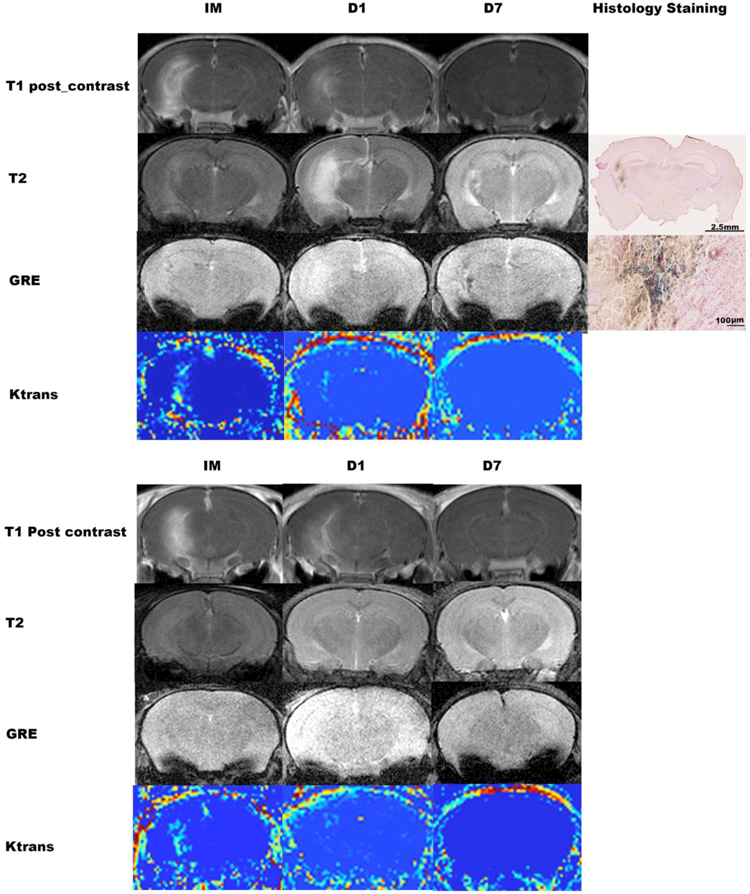
Fig. 2. Time course of MRI changes from 2 example mice treated with high acoustic power, and Prussian blue staining images from the one animal showing bleeding on GRE.

A: Immediately (IM) after sonication, both T1-post contrast imaging and DCE imaging showed BBB opening in the target area, and T2-weighted images showed mildly increased signal in the area with BBB opening. GRE did not show bleeding. On Day 1 (D1) post sonication, the enhancement on post contrast T1-weighted imaging and the area with increased Ktrans on DCE imaging was smaller. There was a clearly-increased signal on T2-weighted imaging, and no bleeding on GRE. On Day 7 (D7) post sonication, there was no enhancement on T1-post contrast and DCE imaging, but GRE showed bleeding. B: Immediately after sonication, both T1-post contrast imaging and the DCE imaging showed BBB opening in the target area. At D1, the enhancement on T1-post contrast imaging and the area with increased DCE intensity became smaller, and by Day 7 there was no enhancement on T1-post contrast or DCE imaging. T2-weighted images and GRE did not show change at any of the three time points.
T1: T1-weighted imaging; T2: T2-weighted imaging; GRE: gradient-echo; DCE: dynamic contrast enhanced.
