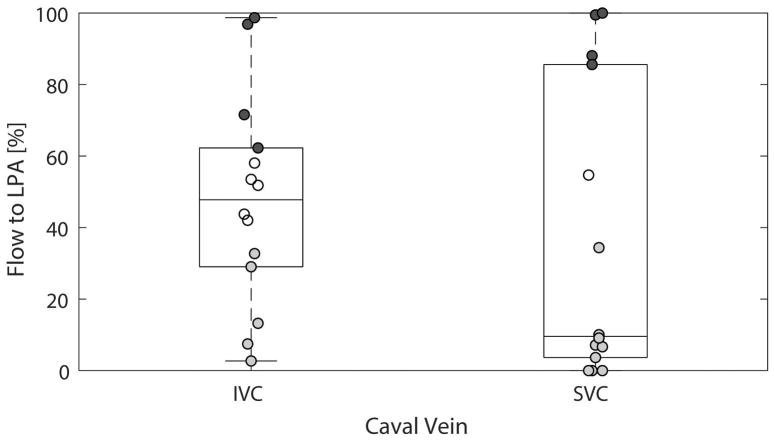
Figure 5.
Traditional pathlines results (i.e. σ = 0 m/s). Boxplots and scatterplots (i.e. showing each data point) are shown. The data points showing preferential flow, i.e. absolute difference between flow distribution to the LPA and RPA is ≥20%, are shaded (dark gray = to the LPA, light gray = to the RPA).

