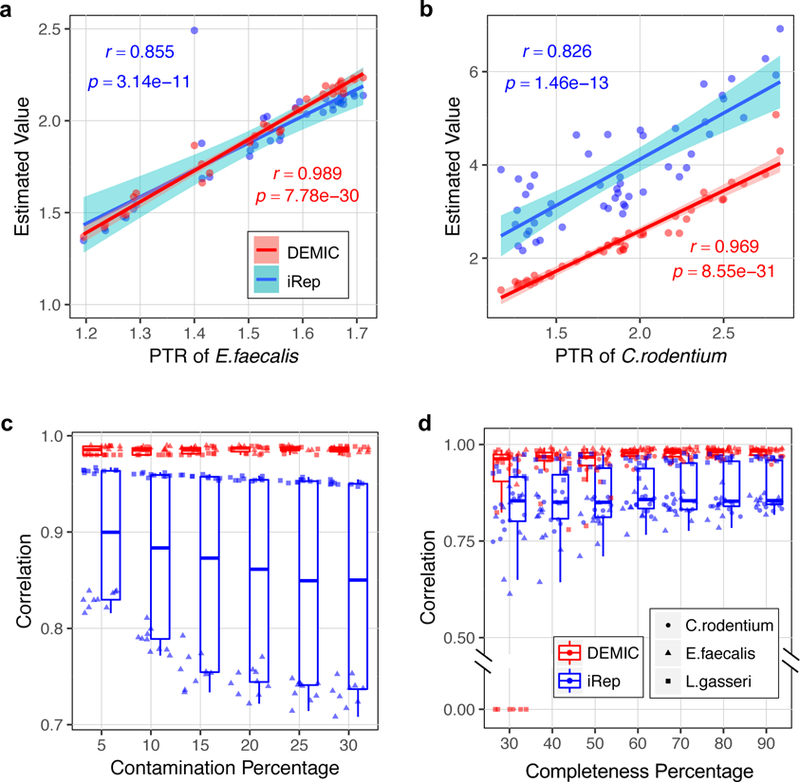
Figure 2. Performance evaluation of DEMIC based on sequencing data sets of three species.

(a-b) Correlations of estimates from DEMIC and iRep with PTR values (Pearson’s r value) in 36 data sets of Enterococcus faecalis (a) and 50 data sets of Citrobacter rodentium (b). The shading areas indicate 99% level of confidence interval. (c-d) Evaluation of the effects of contig contamination (c) and completeness (d) of the contig cluster on the performances of DEMIC and iRep. Evaluations of the sample size and contig cluster completeness were based on L. gasseri, E. faecalis and C. rodentium (n = 10 for each), and evaluation of contig contaminations was based on L. gasseri and E. faecalis (n = 10 for each). Correlations of all evaluations were plotted, and the boxplots indicate the median (center line), first and third quartiles (box edges), and 1.5 times the interquartile range (whiskers).
