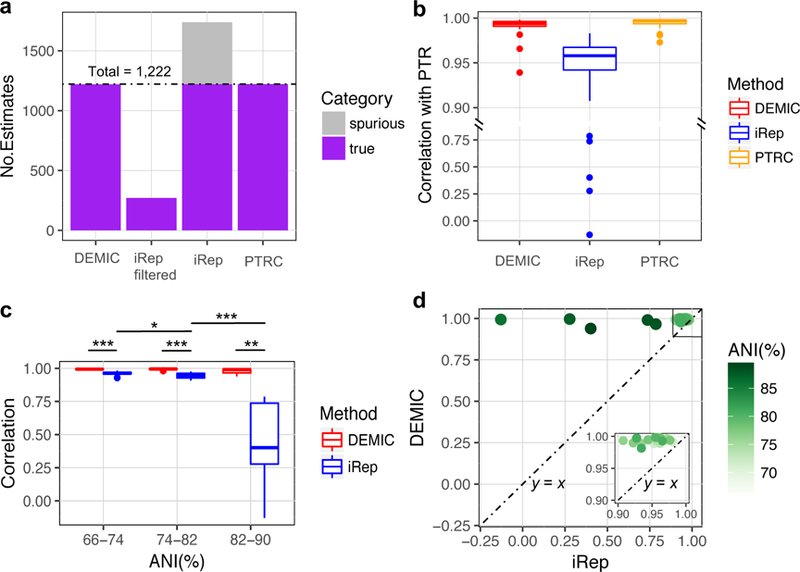
Figure 3. Performance evaluation of DEMIC based on simulated data of 45 closely related species from five phyla.

(a) DEMIC estimated 1,220 of a total of 1,222 simulated PTRs with no spurious estimates for all species whose contigs were dominant in the 41 contig clusters. (b) The correlation between DEMIC estimates for the 41 contig clusters and PTRs (Pearson’s r value) achieved a similar level with PTRC based on the 41 complete genomes, and outperformed iRep. (c) Significant difference in estimation accuracy of iRep was observed among different ANI groups of species (n = 19, 17 and 5 for ANI% group 66–74, 74–82 and 82–90, respectively), but not the accuracy of DEMIC estimates (two-sided Mann-Whitney U tests, * p value < 0.05, ** p value < 0.01, and *** p value < 0.001). For (b) and (c), the boxplots indicate the median (center line), first and third quartiles (box edges), and 1.5 times the interquartile range (whiskers). (d) Correlations (Pearson’s r value) between DEMIC estimates and PTRs were higher than those between iRep estimates and PTRs for all 41 species, and the difference was more pronounced in species sharing higher ANI with others. The inset graph shows species having correlations with PTRs greater than 0.9 by both methods.
