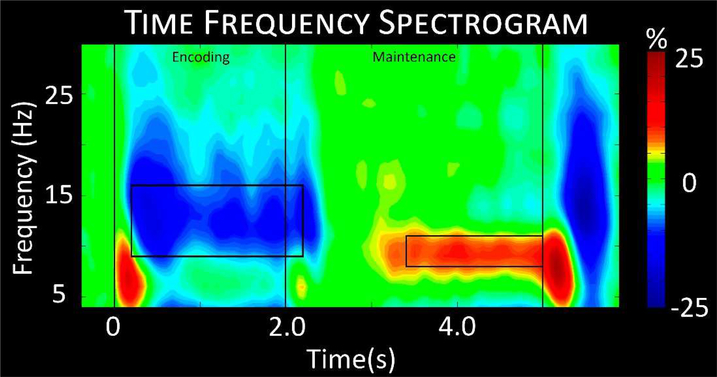
Figure 3.
Time-frequency spectrogram. A grand-averaged time-frequency spectrogram from a representative sensor (M2313) near the parieto-occipital cortices. The same sensor was chosen in each participant. Time is shown on the x-axis in seconds, while frequency is shown on the y-axis in Hz. The colors reflect power increases (red) and decreases (blue) relative to the baseline, with the scale bar shown to the far right. A significant decrease in alpha from 9–16 Hz can be discerned throughout encoding into early maintenance, followed by a significant alpha increase throughout mid to late maintenance in a more narrow 8–11 Hz range. Time-frequency windows for source imaging (beamforming) were derived from statistical analysis of the sensor-level spectrogram data, and these windows are demarcated by the black boxes.

