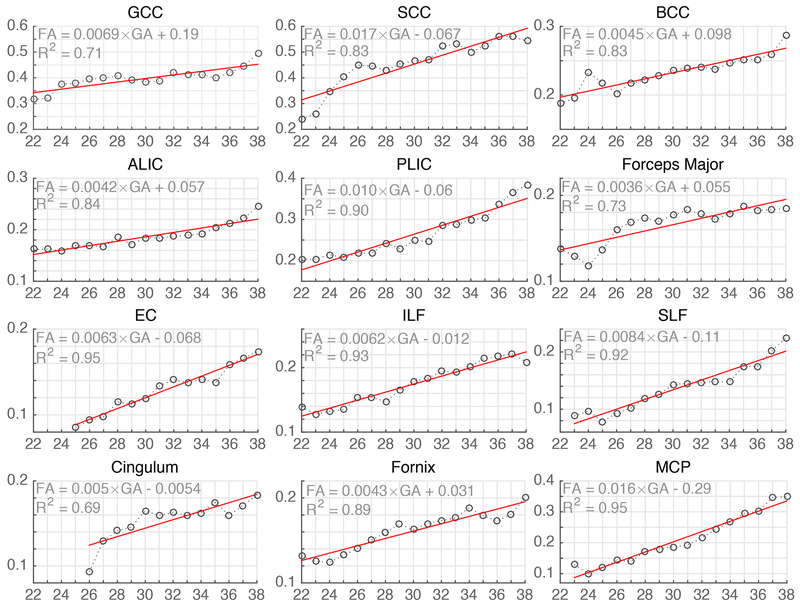
Fig. 8:
Fractional Anisotropy (FA) (y-axis, unitless) plotted against the gestational age (x-axis, in weeks) for major fiber pathway structures. The FA values and trends observed in our atlas are in agreement with previously published ex vivo, preterm infant and in utero studies. The abbreviation used in the figure for fiber structures have been described in the Methods section.

