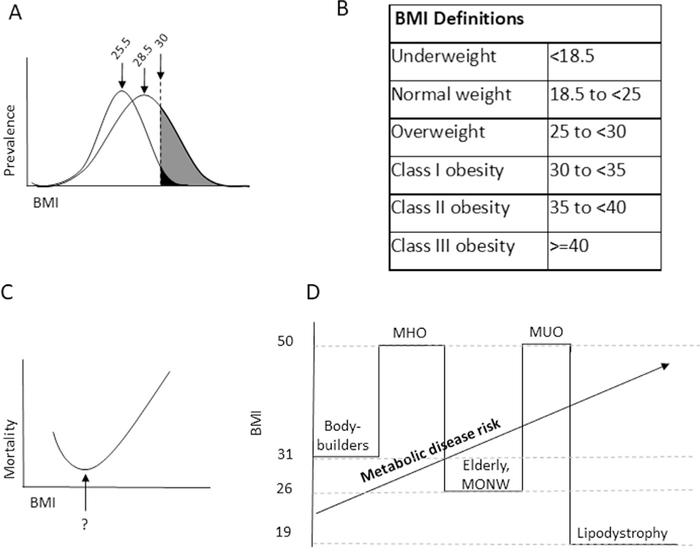
Fig. 1.
Associations of body mass index (BMI) with metabolic disease. (A) Schematic representative BMI prevalence curves in leptogenic and obesogenic environments. In a leptogenic environment, the obese phenotype is restricted to a relatively narrow BMI range, as food scarcity prevents humans with a propensity to obesity to manifest this phenotype. As nutrient availability increases in an obesogenic environment, a relatively modest increase in mean BMI may be associated with a large increase in obesity prevalence as a result of a widening and rightward shift of the BMI population distribution curve, with blossoming of the obese phenotype among susceptible individuals. Mean BMIs shown for each curve are those associated with National Health and Nutrition Examination Survey data from 1970 (25.5) and 2004 (28.5). (B) The relationship between BMI and long-term mortality. The nadir of this curve remains debated but recent epidemiologic data support that it lies between BMI 20 and 25. Similar J-shaped curves describe the relationship between many phenotypic features and disease/mortality risk (e.g., blood pressure). (C) World Health Organization-Centers for Disease Control weight definitions. (D) Limitations in BMI as a metric for metabolic disease risk result from epidemiologic and biologic factors. BMI does not distinguish between adipose and muscle mass, limiting its predictive power for disease risk in athletes and the elderly. Fundamental differences in biology, such as patients with lipodystrophy and metabolically unhealthy obesity, metabolically healthy obesity, or metabolically obese normal weight phenotypes, also limit accuracy.

