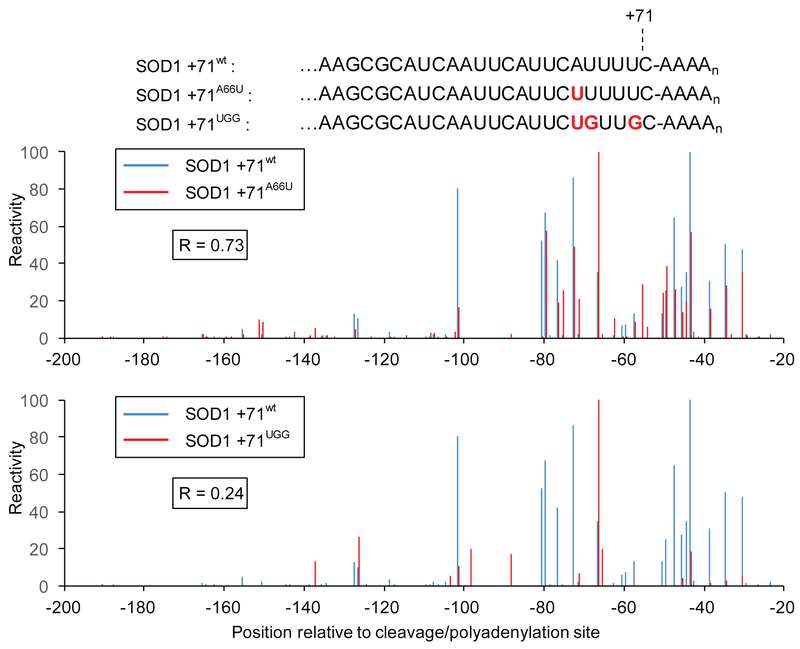
Figure 3. Single point mutations can alter an isoform’s structural profile.
DMS reactivity profile comparison of the wild-type SOD1 +71 (SOD +71wt) isoform to two mutants possessing an identical cleavage/polyadenylation site (SOD1 +71A66U, SOD1 +71UGG). Reactivities for each isoform are scaled relative to that isoform’s highest observed reactivity value (100). Top: A comparison of A and C reactivities for SOD +71wt and the single substitution mutant SOD1 +71A66U reveal modest differences in reactivity profiles. Bottom: Extensive differences in reactivity profiles between SOD +71wt and the triple substitution mutant SOD1 +71UGG.

