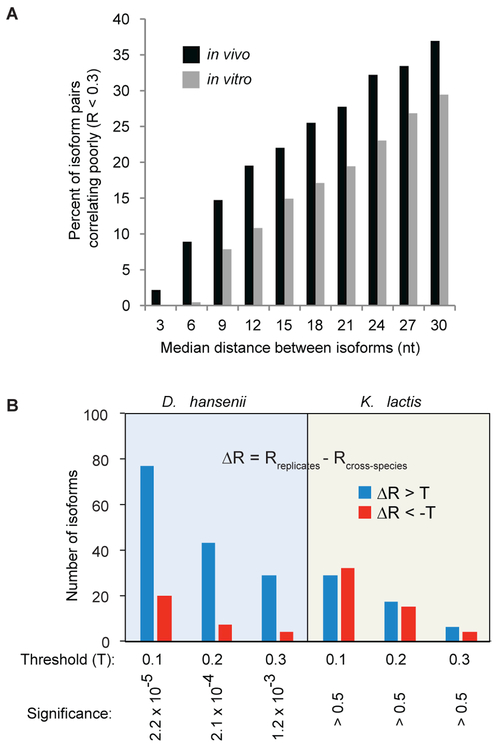
Figure 4. DMS reactivity profiles are influenced by cellular factors.
(A) Percentage of poorly correlating mRNA isoform reactivity profiles (R < 0.3) in in vivo (from Figure 2C, black bars) and in vitro (gray bars) refolded samples as a function of the distance between isoform endpoints.
(B) Left panel: DMS reactivity profile comparison of identical mRNA isoforms from native D. hansenii and from a D. hansenii chromosome segment in an S. cerevisiae host strain. ΔR is the difference by which an isoform’s reactivity profiles correlate in biological replicates compared to the correlation of that isoform’s reactivity profiles in the native species (D. hansenii or K. Lactis) versus when transplanted into S. cerevisiae (Rreplicates – Rcross-species). Blue bars represent isoforms for which the interspecies Pearson correlation is worse (three different ΔR thresholds shown) than the same-species biological replicate correlation. Red bars represent isoforms for which the interspecies correlation is better than the biological replicate; these bars represent the experimental error. Right panel: the same analysis with identical K. lactis isoforms from native and S. cerevisiae-YAC strains.

