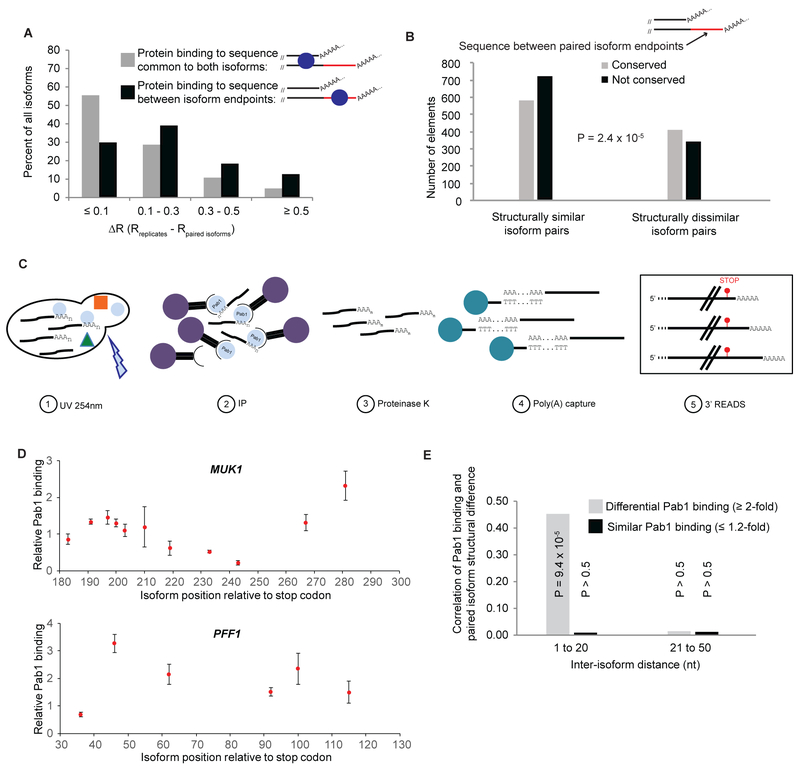
Figure 5. Relationship of isoform-specific protein binding and structure.
(A) Structural similarity of same-gene isoform pairs (compared to structural similarity of same-isoform biological replicates) when protein binding sites are present in common sequences (gray bars) or in the extra sequence unique to the longer of the two isoforms (black bars). ΔR is a measure of the difference in reactivity profiles of two same-gene isoforms compared to the biological replicates of those isoforms (see methods); small ΔR values (≤ 0.1) indicate that the two same-gene isoforms are structurally similar, while larger ΔR values (> 0.3) are indicative of widespread structural differences.
(B) The sequence unique to the longer of two 3’ isoforms is more likely to be evolutionarily conserved when the isoforms are structurally different. For pairs of isoforms with similar folding (left, ΔR < 0.1), the extra sequence unique to the longer isoform is more frequently non-conserved (median PhastCons score in the sequence element < 0.33, black bar) than conserved (median PhastCons score in element > 0.67, gray bar). For structurally dissimilar isoform pairs (right, ΔR > 0.3), this sequence is more frequently conserved than non-conserved.
(C) CLIP-READS schematic. Exponentially growing cells are irradiated with UV light (254 nm) to crosslink RNA-protein complexes, after which the protein of interest is immunoprecipitated from the extract. Immunopurified protein:mRNA complexes are treated with proteinase K to digest bound proteins and mRNAs are captured on oligo(dT) beads. This mRNA population is subjected to isoform-specific deep sequencing by the 3’ READS method (Jin et al., 2015), which allows identification and quantification of the individual mRNA 3’ isoforms bound to the protein of interest (in this example, Pab1) in vivo. An input sample consisting of a portion of the same extract is also subjected to deep sequencing in parallel to the CLIP-READS sample. Isoform frequencies obtained for the CLIP-READS sample are then divided by frequencies obtained in the input sample to arrive at isoform-specific protein binding levels.
(D) Isoform-specific Pab1 binding exhibits considerable variation. Expression-corrected relative Pab1 binding levels for isoforms in two representative genes, with the value of 1 representing the median expression-corrected Pab1 binding for the entire dataset of > 25,000 isoforms.
(E) Correlation of differential Pab1 binding with extensive structural differences in same-gene isoforms ≤ 20 nt apart.

