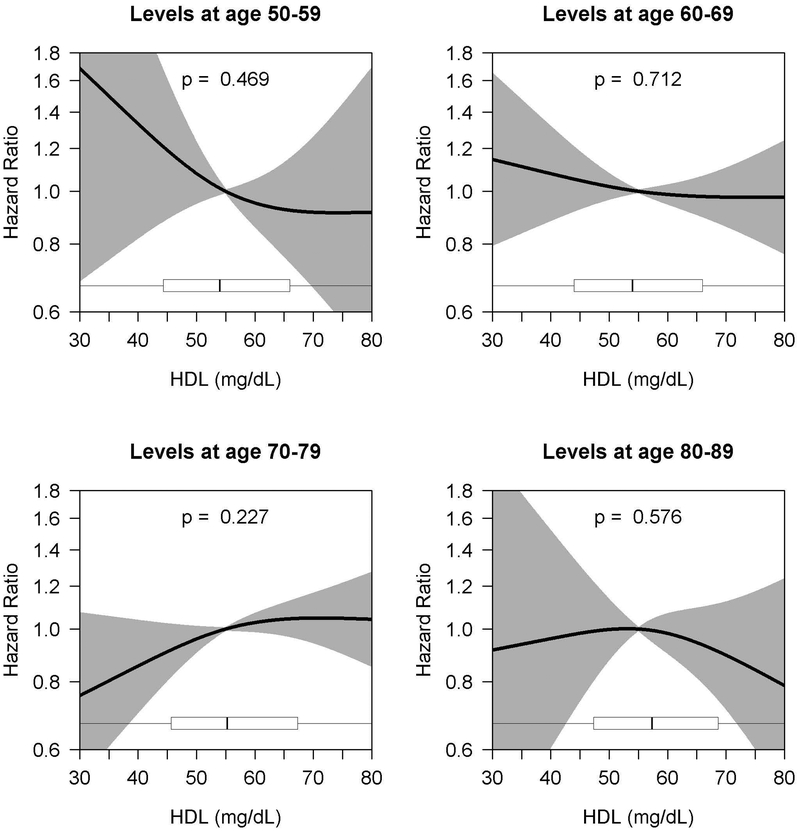
Figure 3.
Age-Varying Association of HDL Cholesterol Levels and Alzheimer’s Disease
aCurves depict hazard ratios (with shading representing 95% confidence intervals) comparing the average HDL cholesterol level given on the x-axis to a reference value of 55 mg/dL. Cholesterol level was modeled using natural cubic splines (with knots at 10%, 50%, and 90%-iles of exposure distributions); p-values provided are for joint (omnibus) tests of these spline parameters. Boxplots summarize the distribution of average HDL cholesterol levels observed in the sample. Models adjusted for sex, race, education, early life financial difficulty rating, smoking, treatment for hypertension or diabetes, BMI, and stratified by ACT cohort and APOE genotype.

