
Figure 9. Demonstration of improved reproducibility and statistics with new partition.
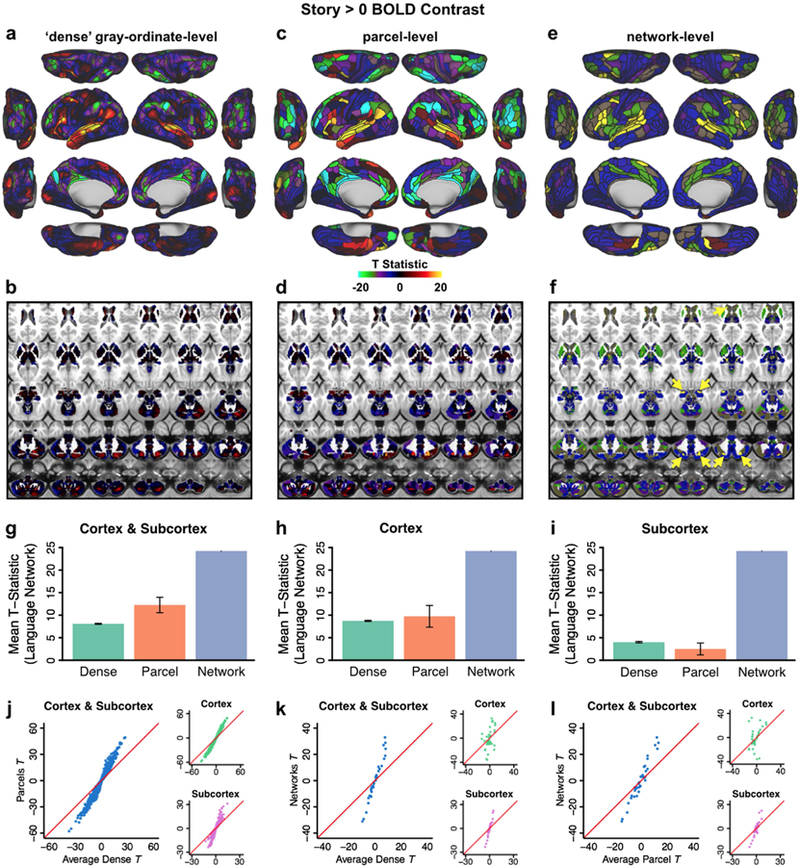
Panels A-F show task activations for a language processing (LANGUAGE task ‘Story versus Baseline’ contrast) task at three different levels. A) Cortical activation map of dense-level analysis. B) Subcortical activation map of dense-level analysis. C) Cortical activation map of parcel-level analysis. Task fMRI data were first parcellated at the parcel level before model fitting. D) Subcortical activation map of parcel-level analysis. E) Cortical activation map of network-level analysis. Task fMRI data were first parcellated at the network level before model fitting. F) Subcortical activation map of network-level analysis. Yellow arrows highlight subcortical regions with a high task-activated t-score, which overlap with parcels in the LAN network. G) t-statistics (LANGUAGE task ‘Story versus Baseline’ contrast) shown in panels A-F significantly improve for the parcel-level vs. dense-level analysis, and for the network-level vs. parcel-level analysis in a combined cortex and subcortex analysis. Error bars are inter-parcel standard deviations. H) tstatistics (LANGUAGE task ‘Story versus Baseline’ contrast) in cortex alone again show significantly 33 better results for the network-level analysis compared to the dense- and parcel-level analyses. I) t-statistics (LANGUAGE task ‘Story versus Baseline’ contrast) in subcortex showed substantially better results for the network-level analysis compared to the dense- and parcel-level analyses. Note that – in contrast to the results for cortex – parcel-level analysis in subcortex does not give an advantage over dense-level analysis. J) An improvement in t-statistics was found when task designs were fit on parcellated time series instead of on dense time series and subsequently averaging for parcels. Blue dots represent 718 parcels × 3 LANGUAGE task contrasts (‘Story versus Baseline’; ‘Math versus Baseline’; ‘Story versus Math’). Insets show the 360 cortical parcels × 3 contrasts (top, green dots) and 358 subcortical parcels × 3 contrasts (bottom, purple dots) separately. K) Improvement in t-statistics was also found when fitting task designs on network time series compared to fitting on dense time series and then averaging for networks. Blue dots represent 12 networks × 3 LANGUAGE task contrasts. Insets show the 12 cortical networks × 3 contrasts (top, green dots) and 12 subcortical parcels × 3 contrasts (bottom, purple dots) separately. L) A further improvement in t-statistics was found when fitting on networks versus fitting on parcels and then averaging for networks. Blue dots represent 12 networks × 3 LANGUAGE task contrasts. Insets show the 12 cortical networks × 3 contrasts (top, green dots) and 12 subcortical parcels × 3 contrasts (bottom, purple dots) separately.