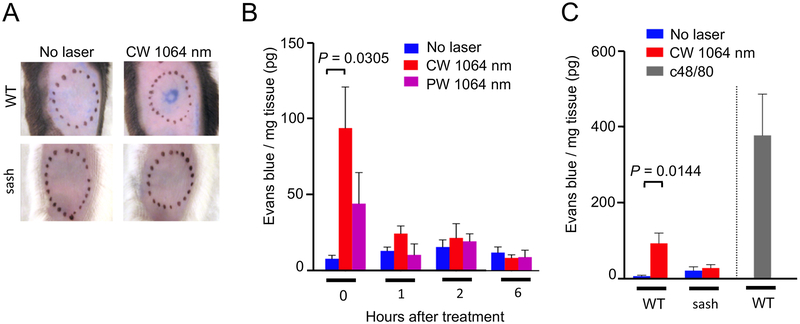
Figure 6. The effect of the NIR laser on microvascular permeability in skin.
The effect of the NIR laser treatment on microvascular permeability in skin. A, Representative images of the mouse back skin 30 minutes after intravenous injection of Evans blue are shown. B, Quantification of tissue concentration of Evans blue 0, 1, 2 and 6 hours after the 1-minute CW or PW NIR 1064 nm laser treatment is shown. n= 8, 12, 6 for no laser, CW 1064 nm, PW 1064 nm groups at 0 h, and n= 3, 3–4, 3–4 for no laser, CW 1064 nm, PW 1064 nm groups at 1, 2 and 6 hours, respectively. One-way ANOVA followed by Tukey’s HSD tests. C, The effect of the NIR laser on microvascular permeability in skin in WT and sash mice. Quantification of tissue concentration of Evans blue 0 hour after the 1-minute CW NIR 1064 nm laser treatment in WT and sash mice is shown. n= 8, 12, 3, 5, 5 for no laser in WT, CW 1064 nm in WT, no laser in sash, CW 1064 nm in sash, c48/80 in WT mice groups, respectively. Two-way ANOVA followed by the Tukey’s HSD tests. WT data of the no laser group at 0 hour from Fig. 6B are shown for comparison. A–C, Results were pooled from 3 independent experiments.

