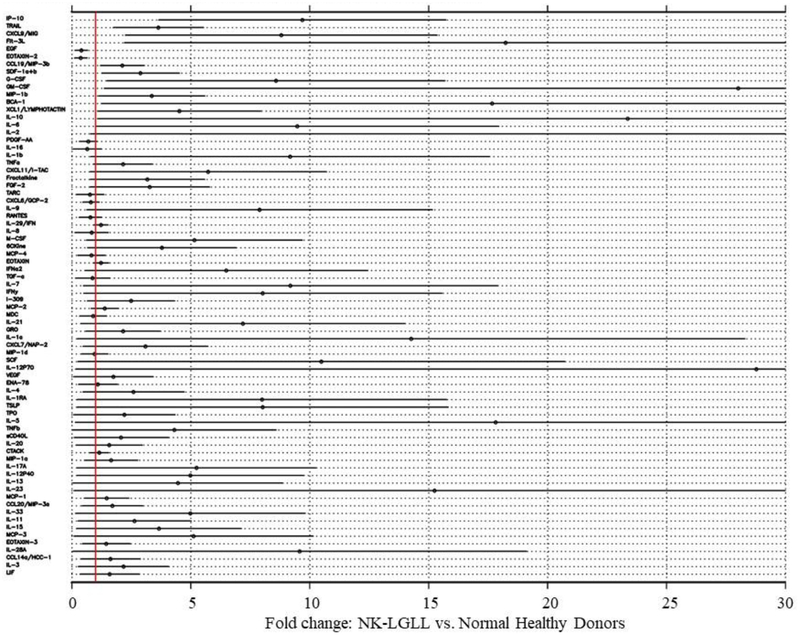
Figure 10. Human NK-LGLL and normal healthy donor serum cytokine analysis.
Serum samples from eight NK-LGLL patients (NK-LGLL # 1 −8) and eight normal healthy donors (Normal Donor #1 – 8) were analyzed by three Luminex cytokine panels, which total 75 individual cytokines. Analyses were carried out after transforming cytokine levels to the log10 scale. The table is sorted based on p-value, with the 15 cytokines at the top of the graph significantly different in NK-LGLL patients compared to the healthy controls (p<0.05). IL-2 parameters in this graph are off-scale (fold change 84.8, 95% CI (0.8, 168.9).

