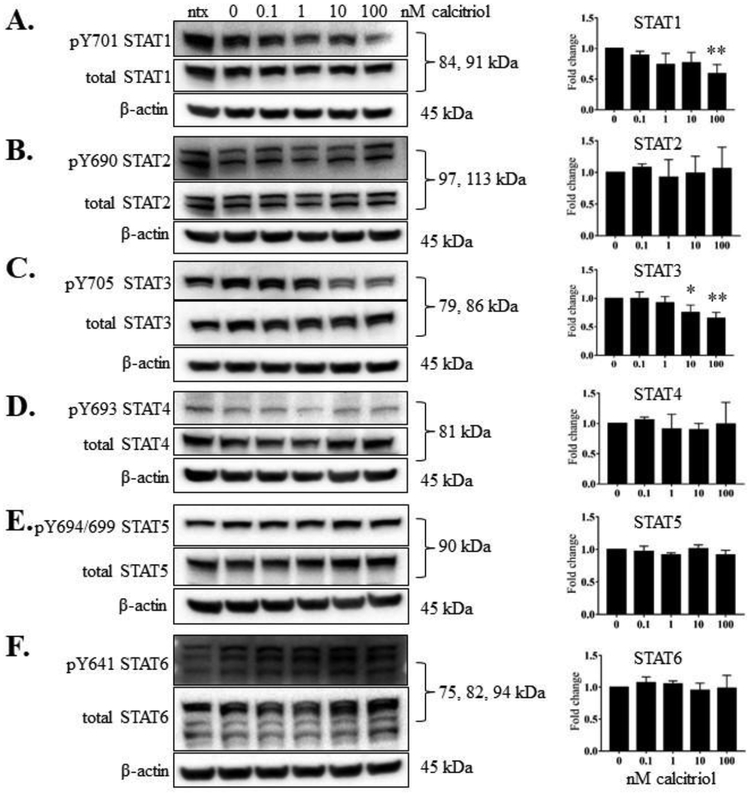
Figure 2. Calcitriol significantly reduced phosphorylation of STAT1 and STAT3 in NKL cells.
The NKL cell line was treated with the indicated doses of calcitriol, or appropriate negative controls, for 24 h. Total protein loaded per sample was 40 μg with β-actin used as a loading control. Representative western blots for each STAT showing phosphorylated and corresponding total protein are shown: (A) STAT1, (B) STAT2, (C), STAT3, (D) STAT4, (E), STAT5, (F) STAT6. Data from three independent experiments were quantified to determine relative expression levels for phosphorylated STATs 1 – 6 and quantification is shown to the right of each representative western blot. The fold change in the graphs represent p-STAT over corresponding total STAT. For STATs with multiple isoforms, the isoform quantifications were combined to give one value for each STAT. Repeated measures ANOVA were used to determine significance of calcitriol treatment compared to 0 nM vehicle control (* p<0.05, ** p<0.01, *** p <0.001). For graphical representation, the vehicle control was set to 1.

