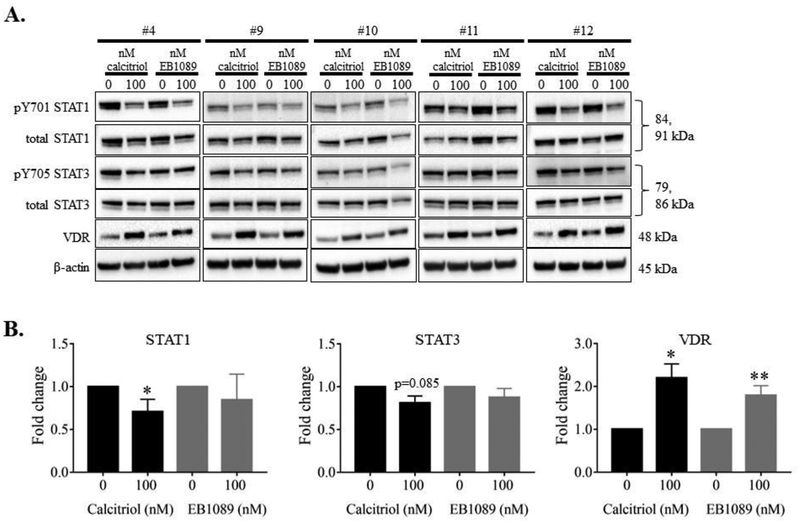
Figure 9. NK-LGLL patient PBMCs treated with calcitriol or EB1089 show STAT1 and STAT3 phosphorylation decrease and VDR increase.
NK-LGLL patient PBMC samples (#4, 9–12) were treated with 100 nM calcitriol or EB1089 or vehicle controls, for 24 h. Total protein loaded per sample was 25 μg with β-actin used as a loading control (A). The blots were quantified and graphed (B). The fold change in the graphs represent p-STAT over corresponding total STAT or VDR over β-actin. Repeated measures ANOVA was used to determine significance of treatment compared to 0 nM vehicle control (* p<0.05, ** p<0.01). For graphical representation, the vehicle control was set to 1.

