Figure 1.

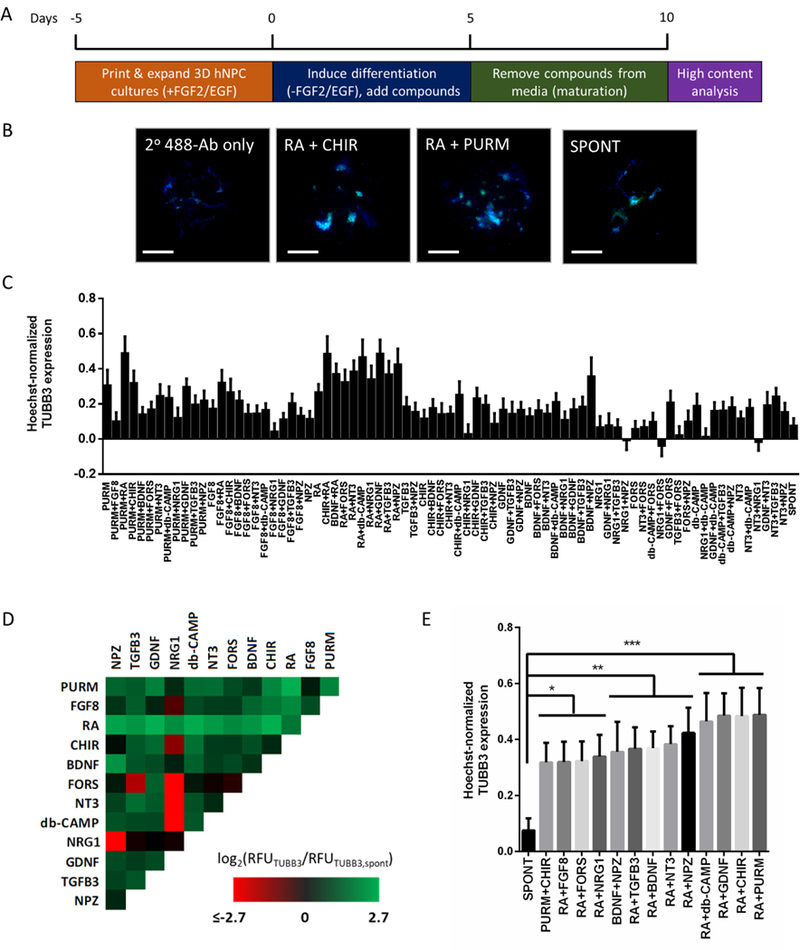
Individual and combined effects of 12 soluble differentiation factors on TUBB3 expression within microscale 3D hNPC cultures. (A) 3D hNPC differentiation screen schematic. (B) Representative immunofluorescence-based images used for high-content analysis of 3D hNPC differentiation outcomes. Chosen images depict antibody-based detection of TUBB3 expression (green) and Hoechst 33342-based detection of cell nuclei (blue) for the no primary antibody control, conditions which increased the relative TUBB3 expression (CHIR + RA and PURM + RA), and the spontaneous (no factors added) control. Scale bar = 300 μm. (C) The average Hoechst 33342 normalized TUBB3 expression from n = 12 collected from three independent screens is plotted for each condition tested. Mean ± SEM plotted. (D) Log2 heat map of TUBB3 expression relative to spontaneous differentiation. Three replicate screens were performed and the log2 relative fluorescence of each screened condition was normalized by that of the spontaneous differentiation. To elucidate the influence of individual and combination treatments, the log2 values were used to generate a heat map by correlating values to a color gradient between the minimum (red) and maximum (green) values. (E) Select conditions from 3D hNPC neuronal differentiation screen. One-way ANOVA analysis of the Hoechst 33342 normalized TUBB3 expression identified several conditions that resulted in statistically significant different TUBB3 expression compared to the spontaneous differentiation control (*=p<0.05, **=p<0.01, ***=p<0.0001). Mean ± SEM plotted.
