
Figure 3.
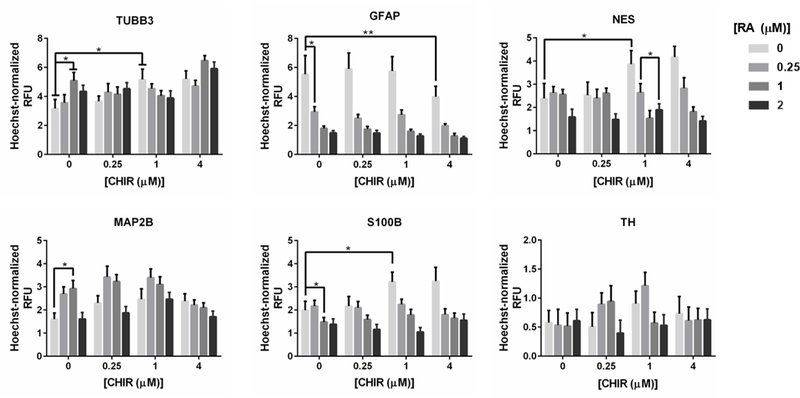
The dose-response effects of RA, CHIR, and their combinations on expression of six cell-type specific protein markers during 3D ReNcell VM hNPC differentiation. The mean immunofluorescence-based RFU was normalized by Hoechst 33342 and averaged over n=9 replicates, compiled from three independent screens. Mean ± SEM plotted. *p < 0.05 from multiple comparisons using Tukey’s correction.