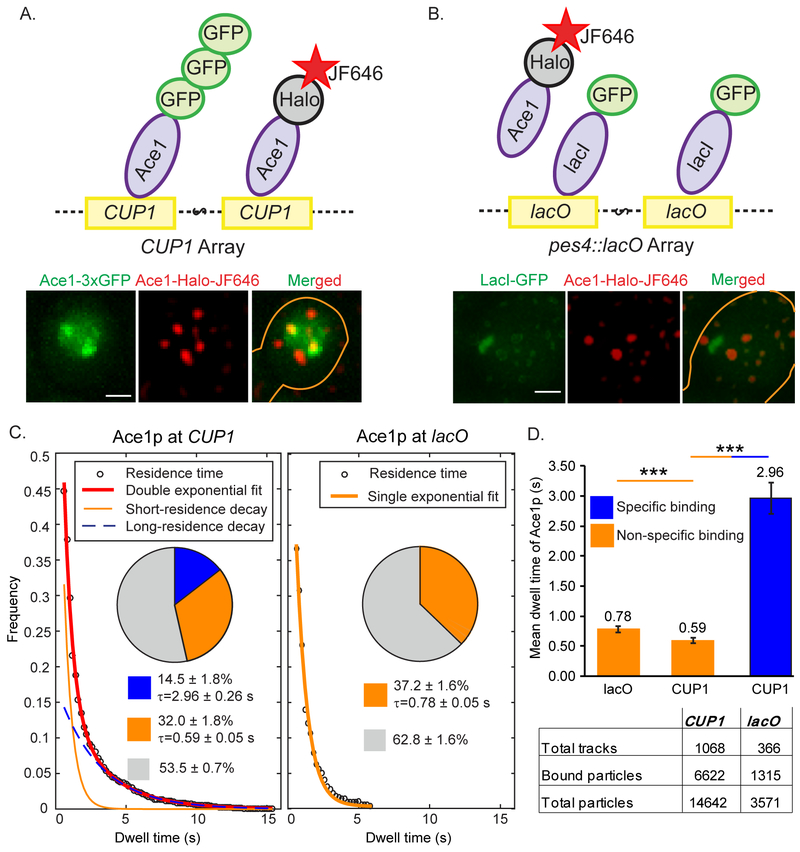
Fig. 1. Assay for specific binding of Ace1p to activated promoters of CUP1.
Ace1p-3xGFP (A) at the CUP1 array in YTK1498 or GFP-lacI (B) at pes4::LacO array in YTK1528 define the site for tracking of the individual molecules of Ace1p-HaloTag labeled with JF646 at a low density of ≤ 5 particles per nucleus. Molecules of Ace1p-HaloTag (JF646) frequently colocalize with CUP1 array and rarely colocalize with lacO array as demonstrated by single focal plane representative images. Gaussian filter was applied to Ace1p-HaloTag (JF646) channel in Track Record software for better visualization of the particles. Here and in Figure 4B and 4C brightness and contrast were adjusted using linear LUT in Image J and cell contours were drawn manually in Adobe Illustrator. Scale bar = 2 μm. See also Movies S1 and S2. (C) Raw distributions of survival of Ace1p particles are shown with the exponential decay fits. For this Figure and for Figures 2 and 6A, pie charts represent the extracted distributions of diffusing (gray), specific (blue) and non-specific (orange) binding events with their average residence times; the table show the number of molecules / tracks observed for a particular sample. (D) The difference between residence times of Ace1p. ‘***’ - p<0.001 by z-test.

