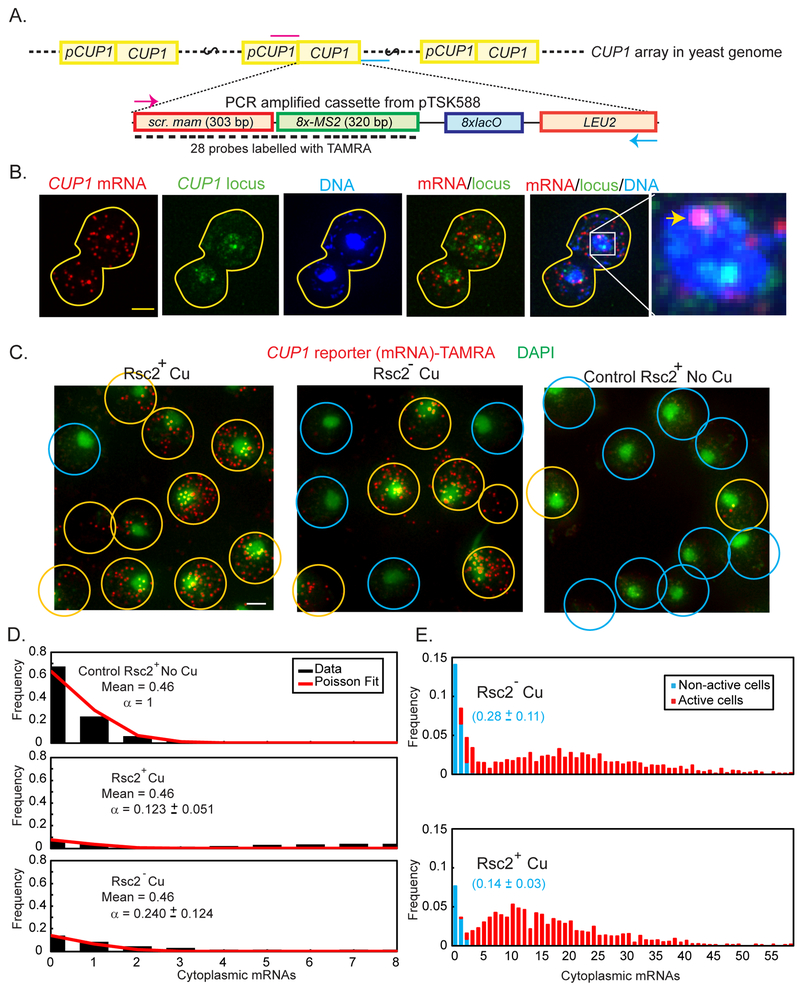
Fig. 4. RSC affects the “on” rate of Ace1p and the availability of RE at the CUP1 promoter.
(A) Diagram of the targeted integration of CUP1 reporter into CUP1 array (not to scale). The cassette contains a scrambled sequence derived from mammalian gene (scr. mam) and eight copies of the phage MS2 binding site, that may be transcribed in a single transcript, but cannot be translated. LEU2 is used as a selective marker for integration. Positions of the primers used to amplify the cassette are marked in magenta (T1010) and cyan (T1004). (B) Maximum Intensity projections of z-stack of a diploid cell containing the CUP1 reporter inserted into one of the two CUP1 arrays. TAMRA (red): Reporter mRNA stained by smFISH probes, Ace1p-3xGFP (green): CUP1 locus, DAPI (blue): nucleus. Overlays: CUP1 reporter mRNA colocalizes with only one of the two CUP1 transcription sites (arrowhead). Scale bar = 2 μm. (C) Population of cells with CUP1-reporter: transcribing (yellow circles), i.e. containing > 3 molecules of mature mRNA, and not transcribing (blue circles). Overlays of DAPI (green) and CUP1 reporter mRNA (red). Maximal Intensity Projections of the z-stacks of the images of the cells treated by 100 μM Cu2+ for CUP1 activation and 1 mM auxin for Rsc2 depletion and control cells of YTK1649 are presented. Original 15-bit images were scaled in Metamorph with linear LUT with the same range for brightness and contrast. Scalebar = 2 μm. (D) Counts of mature mRNA in control cells not activated by Cu2+ (upper panel, black bars) are fit to Poisson distribution with mean 0.46. The same Poisson distribution (mean = 0.46) can be used to fit the initial points of the distribution of mature mRNA in cells activated by Cu2+, both Rsc2+ and Rsc2p-depleted, if it is first scaled by a constant factor, α. (E) Histograms of mature mRNA per cell. The population of non-active cells (blue) was obtained by fitting the histogram cut off at 3 mRNA/cell to a scaled Poisson distribution with a fixed mean of 0.46 mRNA/cell estimated from the non-activated control. The scaling parameter in the fit is used to define the fraction of non-active cells, as represented in blue fonts.

