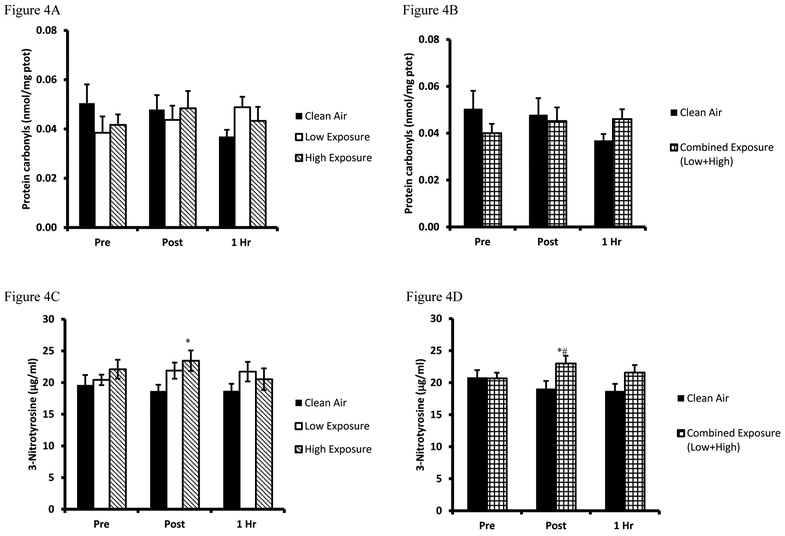
Figure 4. Plasma protein oxidative damage biomarkers.
A. Protein carbonyl values are expressed in standard comparison to Protein Carbonyl equivalents (µM) for Clean Air (black bars), Low Exposure (white bars), and High Exposure (striped bars). B. Protein carbonyl values between Clean Air (white bars) and Combined (Low/High Exposure Average, checkered bars), are expressed in standard comparison to Protein Carbonyl equivalents (µM). C. Nitrotyrosine values are expressed in standard comparison to Nitrotrysine protein content (µg/ml). D. Nitrotyrosine values between Clean Air (white bars) and Combined (Low/High Exposure Average, checkered bars) are expressed in standard comparison to Nitrotrysine protein content (µg/ml). Means are expressed ± SEM.

