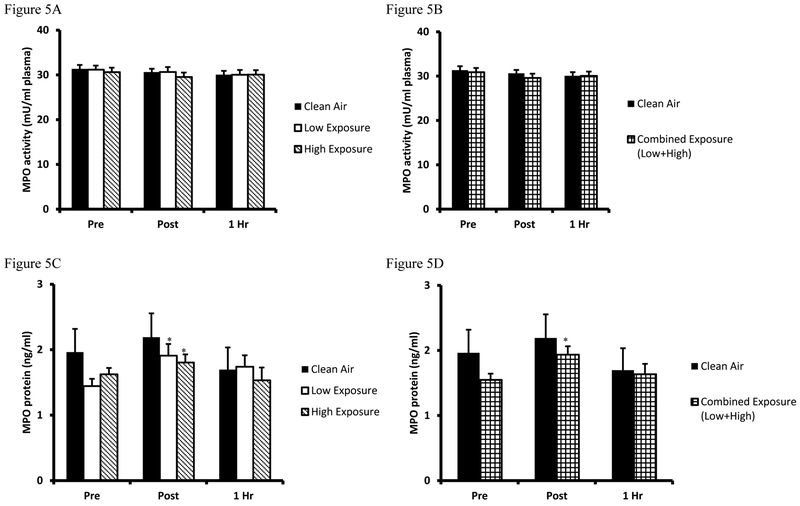
Figure 5. Plasma MPO concentration and MPO activity.
A. Myeloperoxidase activity values are expressed in standard comparison amount of myeloperoxidase activity (mU/ml plasma) for Clean Air (black bars), Low Exposure (white bars), and High Exposure (striped bars). B. Myeloperoxidase activity between Clean Air (white bars) and Combined (Low/High Exposure Average, checkered bars) are expressed in standard comparison amount of myeloperoxidase activity (mU/ml plasma). C. Myeloperoxidase activity values are expressed in standard comparison amount of myeloperoxidase protein content (ng/ml plasma) for Clean Air (black bars), Low Exposure (white bars), and High Exposure (striped bars). D. Myeloperoxidase activity between Clean Air (white bars) and Combined (Low/High Exposure Average, checkered bars) are expressed in standard comparison amount of myeloperoxidase protein content (ng/ml plasma). Means are expressed ± SEM.

