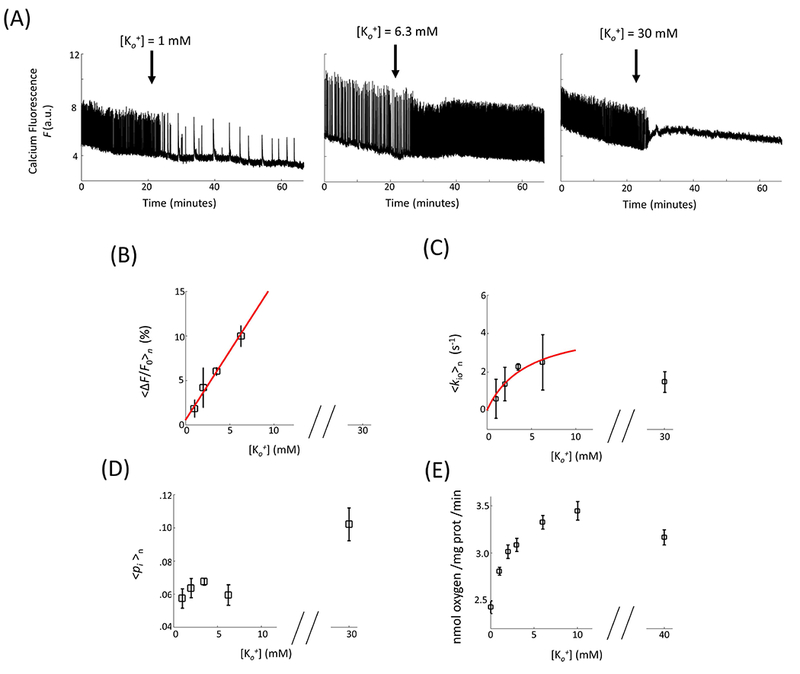
Figure 3.

[Ko+]-dependences. (A) Representative neuronal activity in OCC in response to change (arrow) in [Ko+] from 3.5 mM to 1 mM (left), 6.3 mM (middle), and 30 mM (right). (B - D) The statistical results of mean neuronal activity (B), cellular water efflux rate constant (C), and intracellular water mole fraction (D) as a function of [Ko+] (n = 12, 8, 132, 12, and 8 for [Ko+] = 1, 2, 3.5, 6.3, and 30 mM, respectively). (ΔF is the temporal F integral in a 30 s moving time window. F0 is the baseline fluorescence signal between neuronal activity events. 〈〉n indicates sample mean.) The red, continuous lines result from linear regression (B) and Michaelis–Menten [M-M] model (C) fittings. The M-M fitting is elaborated in Methods and the parameter values given in the text. (E) is literature (29) data for O2 consumption in isolated rat brain synaptosomes. The points represent means (± standard error of the mean).
