
Figure 8.
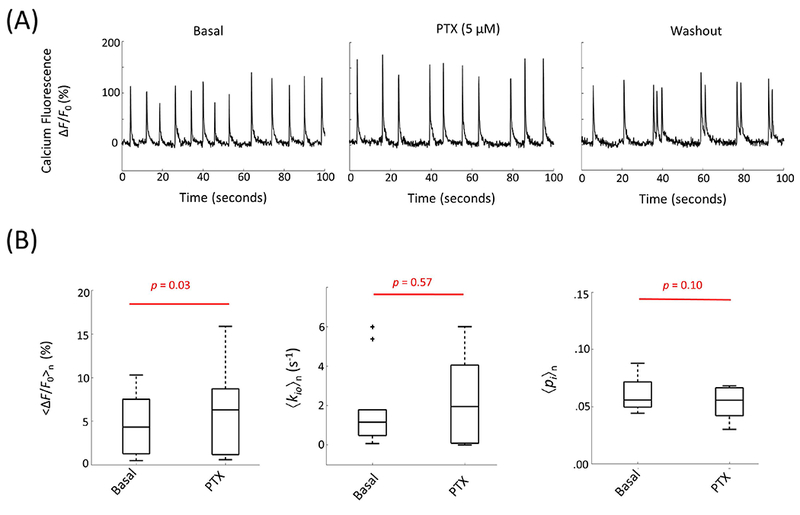
(A) Representative calcium fluorescence signal response to picrotoxin, PTX (5 μM), perfusion and subsequent washout with normal ACSF. (B) The results for 〈ΔF/F0〉n (left), 〈kio〉n (middle), and 〈pi〉n (right) are shown in two phases: basal and PTX perfusion (n = 10).