Figure 3:

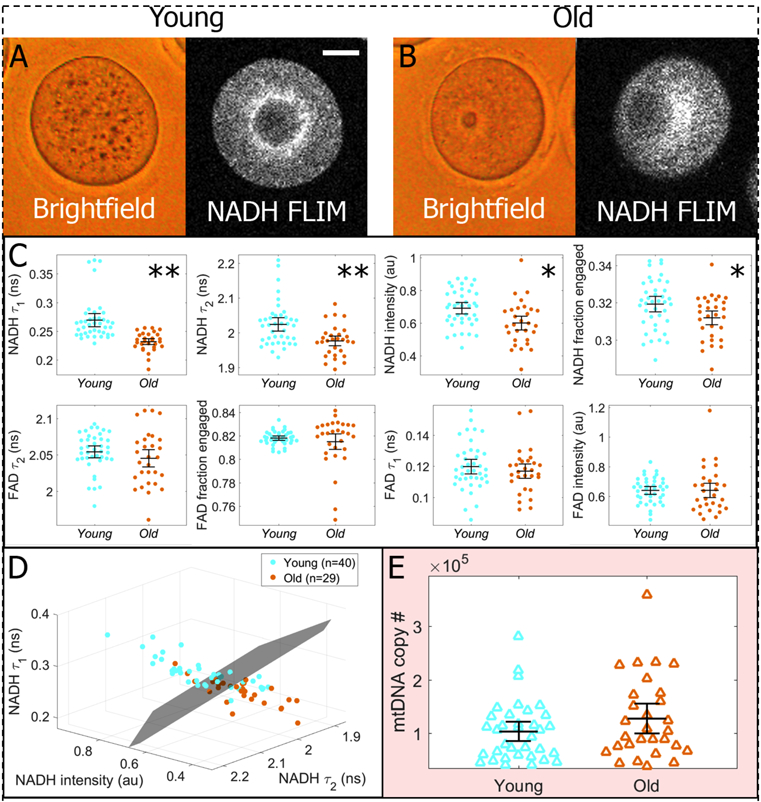
Comparative assessments of oocytes from old (12-month) and young (3-month) mice. A,B) Neither brightfield images nor FLIM intensity images revealed obvious differences in morphology or mitochondrial distribution. 20um bar. C) Conversely, metabolic imaging measurements on the same oocytes effectively differentiated young (n=35) and old (n=29) groups, with four of the eight parameters showing significant differences. Parameters are plotted in order of decreasing separation, with asterisks indicating the following p-values: (*:p<0.02) and (**: p<10−3). P-values were not as low as with Clpp, the more severe case of metabolic dysfunction. D) If the three most sensitive metabolic parameters (NADH intensity NADH short lifetime, and NADH long lifetime) are represented in a 3D plot, we can draw a plane that effectively separates the two data sets; however, there is more overlap between the distributions than in the more extreme case of Clpp. E) mtDNA copy number measurements were taken on young (n=35) and old (n=29) oocytes, and no significant difference between the two groups was observed (p=0.14). Error bars represent standard errors.
