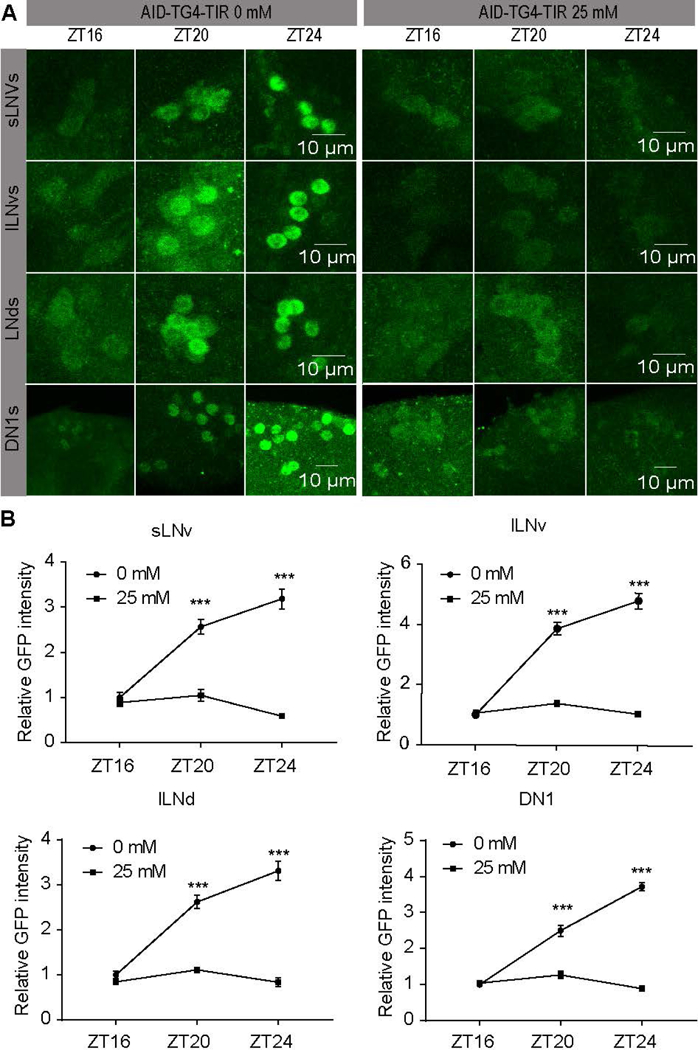
Figure 7. Rapid AID mediated degradation of PER indicated by a kinetic assay.

(A) AID-TG4-TIR flies were feed with 0 mM or 25 mM auxin from ZT12, and then dissection for staining with anti-GFP at ZT16 (n=8), ZT20 (n=10), ZT24 (n=10). Representative LNd, DN1, and LNvs were shown. (B) GFP intensities from analyses of (A). Each time point was normalized to the ZT16 of flies without auxin feeding. The GFP intensity was shown as mean ± SEM. A Student’s two-tailed t-test was employed to determine significance compared to controls and treatments at the same time point. *** P<0.001
