
Figure 2.
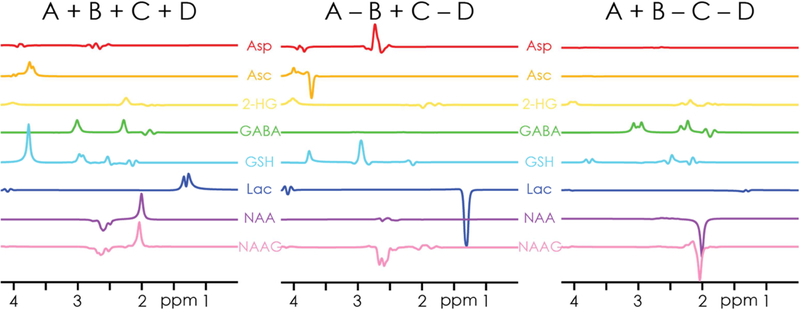
Simulated basis functions of the Hadamard combinations for the eight coupled metabolites edited in the HERCULES experiment. Note the segregation of overlapping signals (e.g., GSH and GABA around 3 ppm) into orthogonal difference spectra (GSH in A-B+C-D, GABA in A+B-C-D), and the differentiation of the NAA- and NAAG-aspartyl singles at 2.6 ppm in the A-B+C-D spectrum. The signal intensities represent equimolar concentrations.