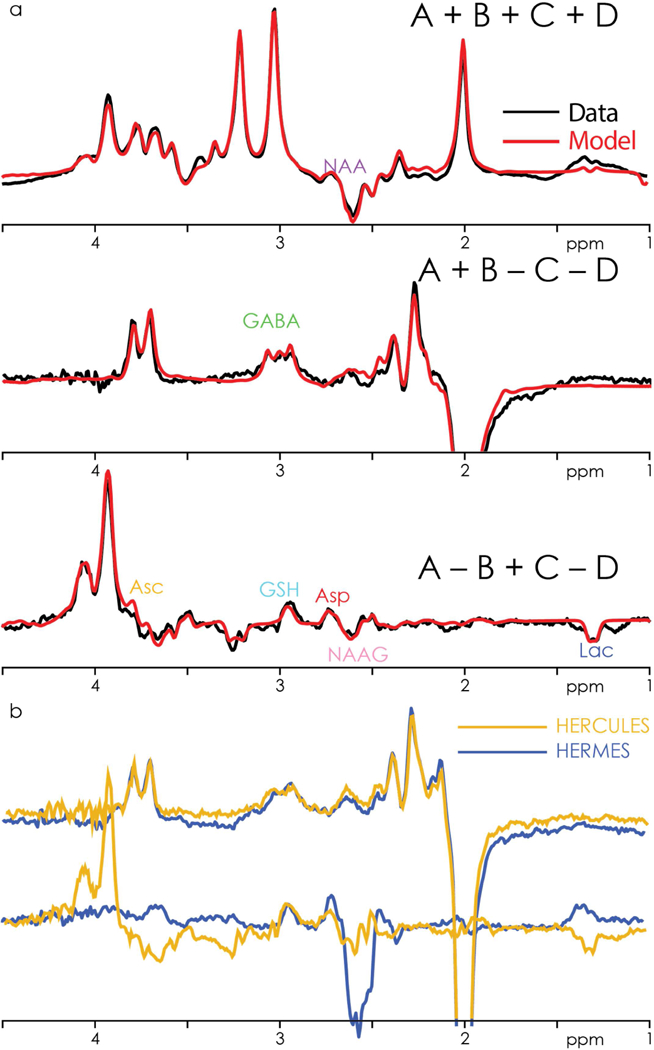
Figure 4.

a. In vivo HERCULES data (black) from one subject (grey-matter voxel), showing the three Hadamard combinations overlaid by the multiplexed linear-combination model (red). The key spectral features of the eight edited metabolites are clearly visible. b. Overlay of the respective GABA- and GSH-edited difference spectra from HERCULES (orange) and HERMES (blue) from a white-matter voxel in one subject.
